

USD/CAD Price Forecast: Jumps to almost a fresh two-month high near 1.3760
- USD/CAD jumps to near 1.3760 as the US Dollar recovers after Iran denies any negotiation talks with the US.
- US President Trump instructed a pause on scheduled military attacks on Iran’s power plants for five days.
- Oil prices' recovery has offered support to the Canadian Dollar.
The USD/CAD pair trades 0.25% higher to near 1.3760 during the early European session on Tuesday, the highest level seen in almost two months. The Loonie pair gains as the US Dollar (USD) bounces back after Iran dismissed the announcement by United States (US) President Donald Trump, claiming talks regarding the de-escalation of the war in the Middle East.
US Dollar Price Today
The table below shows the percentage change of US Dollar (USD) against listed major currencies today. US Dollar was the strongest against the Australian Dollar.
| USD | EUR | GBP | JPY | CAD | AUD | NZD | CHF | |
|---|---|---|---|---|---|---|---|---|
| USD | 0.23% | 0.19% | 0.13% | 0.19% | 0.57% | 0.43% | 0.23% | |
| EUR | -0.23% | -0.06% | -0.11% | -0.01% | 0.34% | 0.20% | -0.00% | |
| GBP | -0.19% | 0.06% | -0.02% | 0.02% | 0.40% | 0.26% | 0.06% | |
| JPY | -0.13% | 0.11% | 0.02% | 0.08% | 0.45% | 0.32% | 0.12% | |
| CAD | -0.19% | 0.01% | -0.02% | -0.08% | 0.37% | 0.22% | 0.03% | |
| AUD | -0.57% | -0.34% | -0.40% | -0.45% | -0.37% | -0.13% | -0.36% | |
| NZD | -0.43% | -0.20% | -0.26% | -0.32% | -0.22% | 0.13% | -0.20% | |
| CHF | -0.23% | 0.00% | -0.06% | -0.12% | -0.03% | 0.36% | 0.20% |
The heat map shows percentage changes of major currencies against each other. The base currency is picked from the left column, while the quote currency is picked from the top row. For example, if you pick the US Dollar from the left column and move along the horizontal line to the Japanese Yen, the percentage change displayed in the box will represent USD (base)/JPY (quote).
During the press time, the US Dollar Index (DXY), which tracks the Greenback’s value against six major currencies, trades 0.2% higher to near 99.35. On Monday, the USD Index turned upside down after US President Donald announced a pause on scheduled military attacks on Iran’s power plants, citing that ongoing talks with Tehran from the last two days regarding a complete and total resolution of our hostilities in the Middle East were “very good and productive”.
Iran’s dismissal to negotiations with the US has revived risk-off sentiment, improving demand for safe-haven assets, such as the US Dollar.
On the domestic front, traders remain confident that the Federal Reserve (Fed) will either hold interest rates steady or raise them this year amid higher energy prices due to supply shocks.
Though investors have underpinned the Canadian Dollar (CAD) against the US Dollar, the former trades firmly against its other peers as oil prices have also rebounded after Iran’s refusal to de-escalation talks with the US. Given that Canada is a net oil exporter, an energy supply shock is a favorable scenario for the Canadian Dollar.
USD/CAD technical analysis
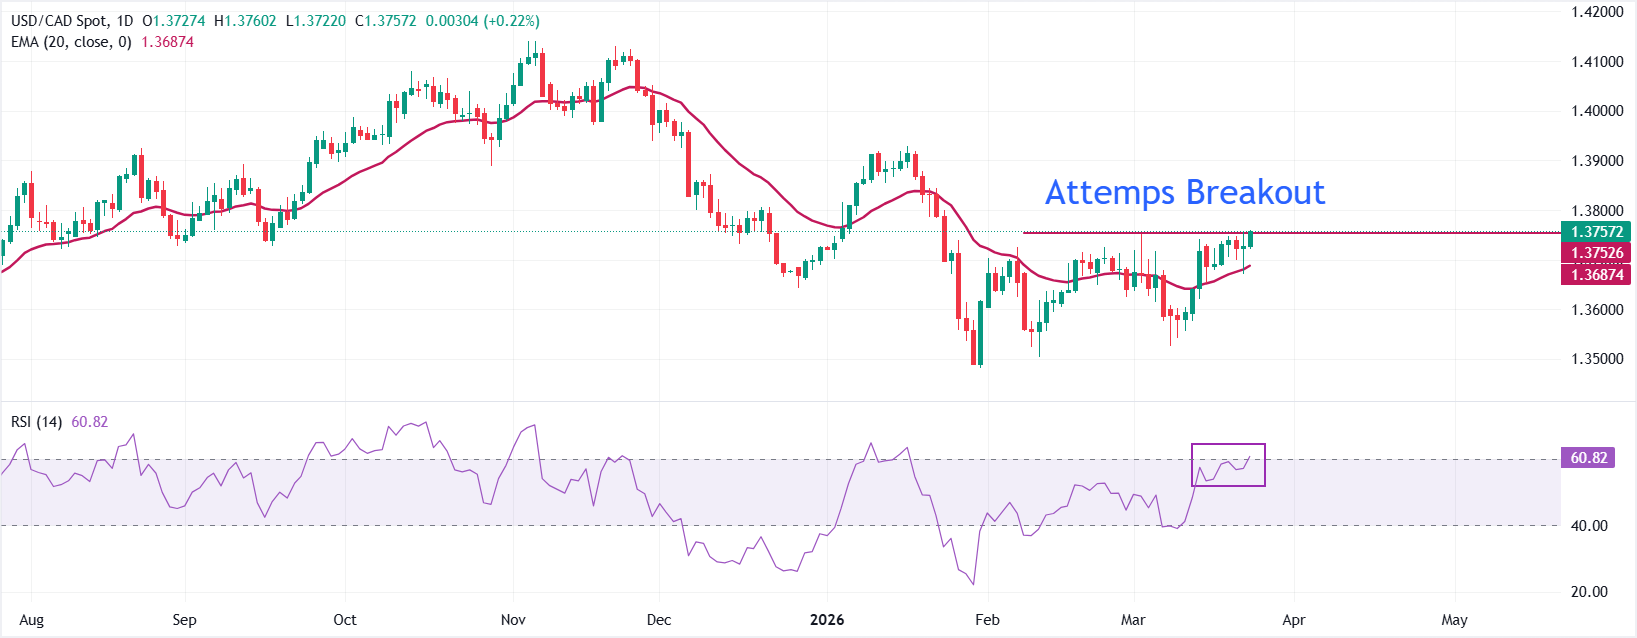
In the daily chart, USD/CAD rises to near 1.3760 in Tuesday's European session. The near-term bias is mildly bullish as spot extends above the 20-day Exponential Moving Average (EMA), which has started to edge higher and underpin the recent series of higher daily closes.
The 14-day Relative Strength Index (RSI) around 61 confirms improving upside momentum rather than stretched conditions, suggesting buyers retain control while the pair holds above the short-term average.
Initial support emerges at 1.3685, aligning with the rising 20-day EMA, with a deeper floor at 1.3640, where the latest pullback base formed. A break below 1.3640 would weaken the bullish structure and expose the 1.3585 region next. On the topside, immediate resistance stands at the January 23 high of 1.3700, ahead of a more significant barrier near 1.3840, where a rejection would signal fading upside pressure.
(The technical analysis of this story was written with the help of an AI tool.)
US Dollar FAQs
The US Dollar (USD) is the official currency of the United States of America, and the ‘de facto’ currency of a significant number of other countries where it is found in circulation alongside local notes. It is the most heavily traded currency in the world, accounting for over 88% of all global foreign exchange turnover, or an average of $6.6 trillion in transactions per day, according to data from 2022. Following the second world war, the USD took over from the British Pound as the world’s reserve currency. For most of its history, the US Dollar was backed by Gold, until the Bretton Woods Agreement in 1971 when the Gold Standard went away.
The most important single factor impacting on the value of the US Dollar is monetary policy, which is shaped by the Federal Reserve (Fed). The Fed has two mandates: to achieve price stability (control inflation) and foster full employment. Its primary tool to achieve these two goals is by adjusting interest rates. When prices are rising too quickly and inflation is above the Fed’s 2% target, the Fed will raise rates, which helps the USD value. When inflation falls below 2% or the Unemployment Rate is too high, the Fed may lower interest rates, which weighs on the Greenback.
In extreme situations, the Federal Reserve can also print more Dollars and enact quantitative easing (QE). QE is the process by which the Fed substantially increases the flow of credit in a stuck financial system. It is a non-standard policy measure used when credit has dried up because banks will not lend to each other (out of the fear of counterparty default). It is a last resort when simply lowering interest rates is unlikely to achieve the necessary result. It was the Fed’s weapon of choice to combat the credit crunch that occurred during the Great Financial Crisis in 2008. It involves the Fed printing more Dollars and using them to buy US government bonds predominantly from financial institutions. QE usually leads to a weaker US Dollar.
Quantitative tightening (QT) is the reverse process whereby the Federal Reserve stops buying bonds from financial institutions and does not reinvest the principal from the bonds it holds maturing in new purchases. It is usually positive for the US Dollar.
추천 기사


