

AUD/USD sees data-heavy second half of the week post-RBA
- RBA minutes showed data-dependent stance; Q4 Wage Price Index on Wednesday and January employment change (20K forecast) on Thursday are the key domestic catalysts.
- FOMC minutes on Wednesday, US Q4 GDP and core PCE on Friday round out a packed week for the pair.
- Data-heavy second half of the week after data-dependent RBA minutes.
The Reserve Bank of Australia (RBA) minutes released Tuesday showed the board judged its recent rate hike was necessary but stressed that future decisions will depend entirely on incoming data and the evolving balance of risks. With the cash rate at 3.60% and markets pricing roughly a 70% chance of another hike at the May meeting, Wednesday's Q4 Wage Price Index (WPI) will be the first test of whether wage pressures are reinforcing the RBA's hawkish stance. Thursday brings January employment data, where the consensus expects 20K jobs added (down from 65.2K prior), a participation rate of 66.8%, and an unemployment rate of 4.2%. Preliminary February S&P Global Purchasing Managers Index (PMI) figures for Australia are also due Thursday.
On the US side, the Federal Reserve (Fed) publishes minutes from its January meeting on Wednesday, where a 10-2 vote held rates at 3.50% to 3.75%; the two dissenting votes that favored an immediate cut will be scrutinized. Thursday features US initial jobless claims and the Philadelphia Fed Manufacturing Survey, while Friday delivers the heavyweight combination of preliminary Q4 Gross Domestic Product (GDP) (3.0% forecast versus 4.4% prior), core Personal Consumption Expenditures Price Index (PCE) (0.3% month-on-month forecast), and final February University of Michigan (UoM) consumer sentiment. Multiple Fed speakers are scheduled, including Bostic, Bowman, Kashkari, Goolsbee, and Daly across Thursday and Friday.
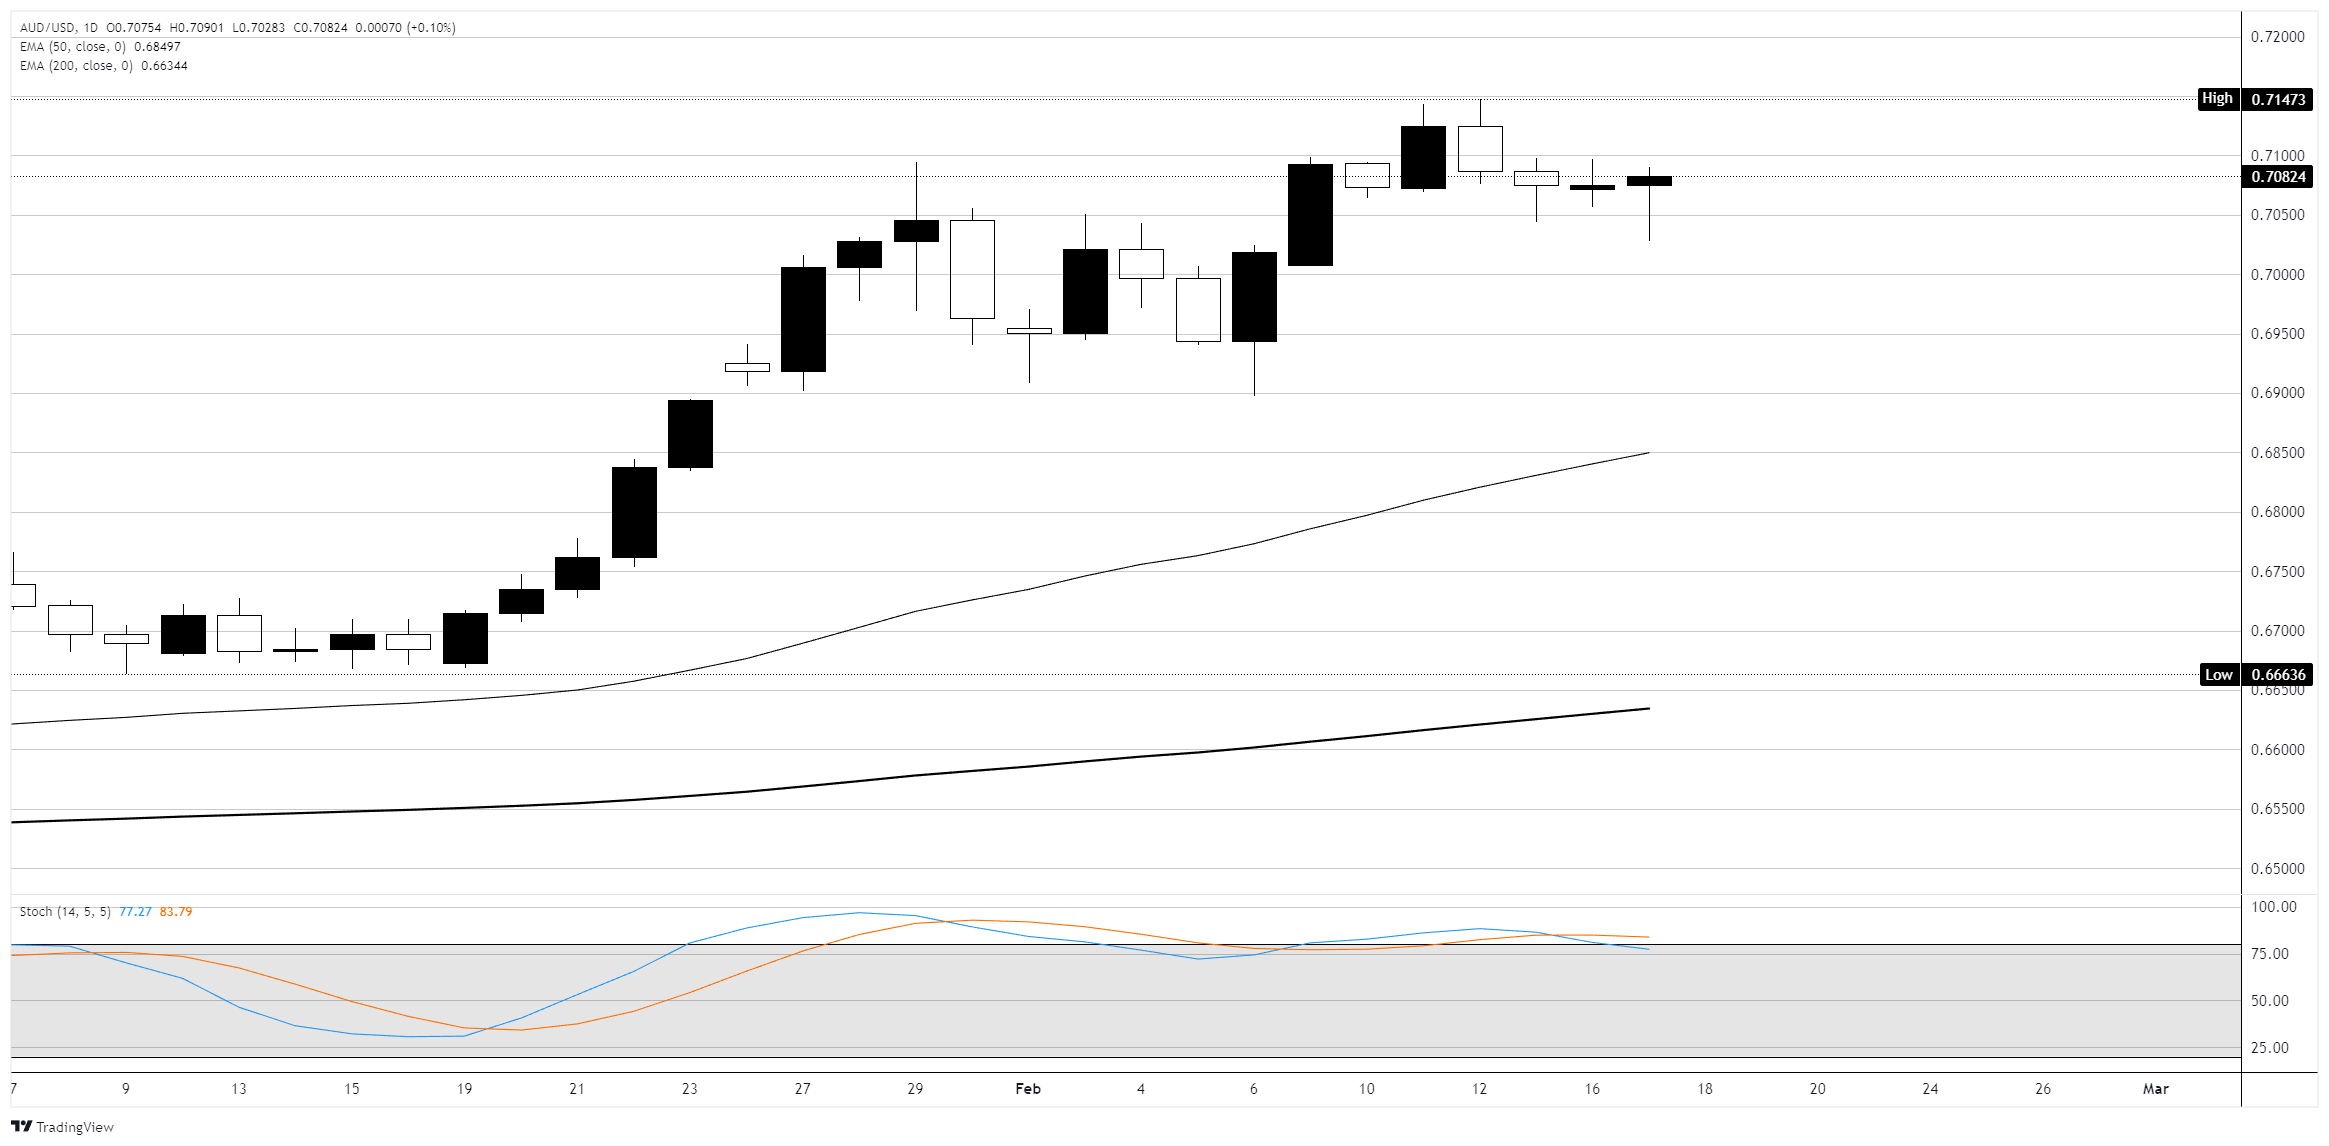
Tight daily range near 0.7082 as Stochastic rolls off overbought
On the daily chart, AUD/USD opened Tuesday at 0.70754, printed a high of 0.70901 and a low of 0.70283, and closed at 0.70824, posting a modest 0.10% decline in a tight-range session. The pair continues to trade well above the rising 50-day Exponential Moving Average (EMA) at 0.68497 and the 200-day EMA at 0.66344, with both averages climbing and widely separated, confirming a strong bullish structure. Price is consolidating below the year-to-date high of 0.71473 after the sharp rally from the January low of 0.66636. The Stochastic Oscillator (14,5,5) shows %K at 77.27 and %D at 83.79, with %K crossing below %D, signaling a bearish divergence from the overbought zone; however, both lines remain above 75, suggesting the pullback is a correction within the trend rather than a reversal.
The candle structure over the past week shows a series of small-bodied candles and doji near the 0.7080 to 0.7100 area, pointing to indecision and consolidation after the February 12 spike to 0.71473. Immediate support sits at Tuesday's low of 0.70283, followed by the 0.7000 psychological level. A break below 0.7000 would open the door to the late-January congestion zone near 0.6940 to 0.6960. On the upside, resistance stands at the 0.7100 handle and the 0.71473 year-to-date high; a daily close above that level would target the 0.7200 area. The wide gap between price and the 50-day EMA (over 230 pips) suggests the pair is extended, and further consolidation or a pullback toward the 0.7000 zone would be a healthy retracement before the next leg higher.
AUD/USD daily chart
Australian Dollar FAQs
One of the most significant factors for the Australian Dollar (AUD) is the level of interest rates set by the Reserve Bank of Australia (RBA). Because Australia is a resource-rich country another key driver is the price of its biggest export, Iron Ore. The health of the Chinese economy, its largest trading partner, is a factor, as well as inflation in Australia, its growth rate and Trade Balance. Market sentiment – whether investors are taking on more risky assets (risk-on) or seeking safe-havens (risk-off) – is also a factor, with risk-on positive for AUD.
The Reserve Bank of Australia (RBA) influences the Australian Dollar (AUD) by setting the level of interest rates that Australian banks can lend to each other. This influences the level of interest rates in the economy as a whole. The main goal of the RBA is to maintain a stable inflation rate of 2-3% by adjusting interest rates up or down. Relatively high interest rates compared to other major central banks support the AUD, and the opposite for relatively low. The RBA can also use quantitative easing and tightening to influence credit conditions, with the former AUD-negative and the latter AUD-positive.
China is Australia’s largest trading partner so the health of the Chinese economy is a major influence on the value of the Australian Dollar (AUD). When the Chinese economy is doing well it purchases more raw materials, goods and services from Australia, lifting demand for the AUD, and pushing up its value. The opposite is the case when the Chinese economy is not growing as fast as expected. Positive or negative surprises in Chinese growth data, therefore, often have a direct impact on the Australian Dollar and its pairs.
Iron Ore is Australia’s largest export, accounting for $118 billion a year according to data from 2021, with China as its primary destination. The price of Iron Ore, therefore, can be a driver of the Australian Dollar. Generally, if the price of Iron Ore rises, AUD also goes up, as aggregate demand for the currency increases. The opposite is the case if the price of Iron Ore falls. Higher Iron Ore prices also tend to result in a greater likelihood of a positive Trade Balance for Australia, which is also positive of the AUD.
The Trade Balance, which is the difference between what a country earns from its exports versus what it pays for its imports, is another factor that can influence the value of the Australian Dollar. If Australia produces highly sought after exports, then its currency will gain in value purely from the surplus demand created from foreign buyers seeking to purchase its exports versus what it spends to purchase imports. Therefore, a positive net Trade Balance strengthens the AUD, with the opposite effect if the Trade Balance is negative.
추천 기사


