

USD/CAD Price Forecasts: US Dollar tests resistance at 1.4045 area
- The Dollar pares losses against the CAD but remains capped below 1.4045.
- A somewhat sourer market sentiment is providing some support to the safe-haven USD.
- Technically, the USD/CAD shows a potential bullish H&S pattern.
The US Dollar ticked higher against the Loonie, as market sentiment soured in the early European session on Friday. The pair tested the resistance area around 1.4045, without success so far, although the Greenback remains steady above the 1.4000 level, after having bounced from 1.3985 lows on Thursday.
The safe-haven US Dollar nudged higher as market sentiment faltered at the European session opening, with the region’s main stock indexes opening in the red. Bulls, however, are lacking acceptance above 1.4045 as investors remain cautious, awaiting a backlog of US data for a better assessment of the US economic outlook and the Fed’s interest rate path
Technical analysis: Potential bullish “H&S" above 1.4045
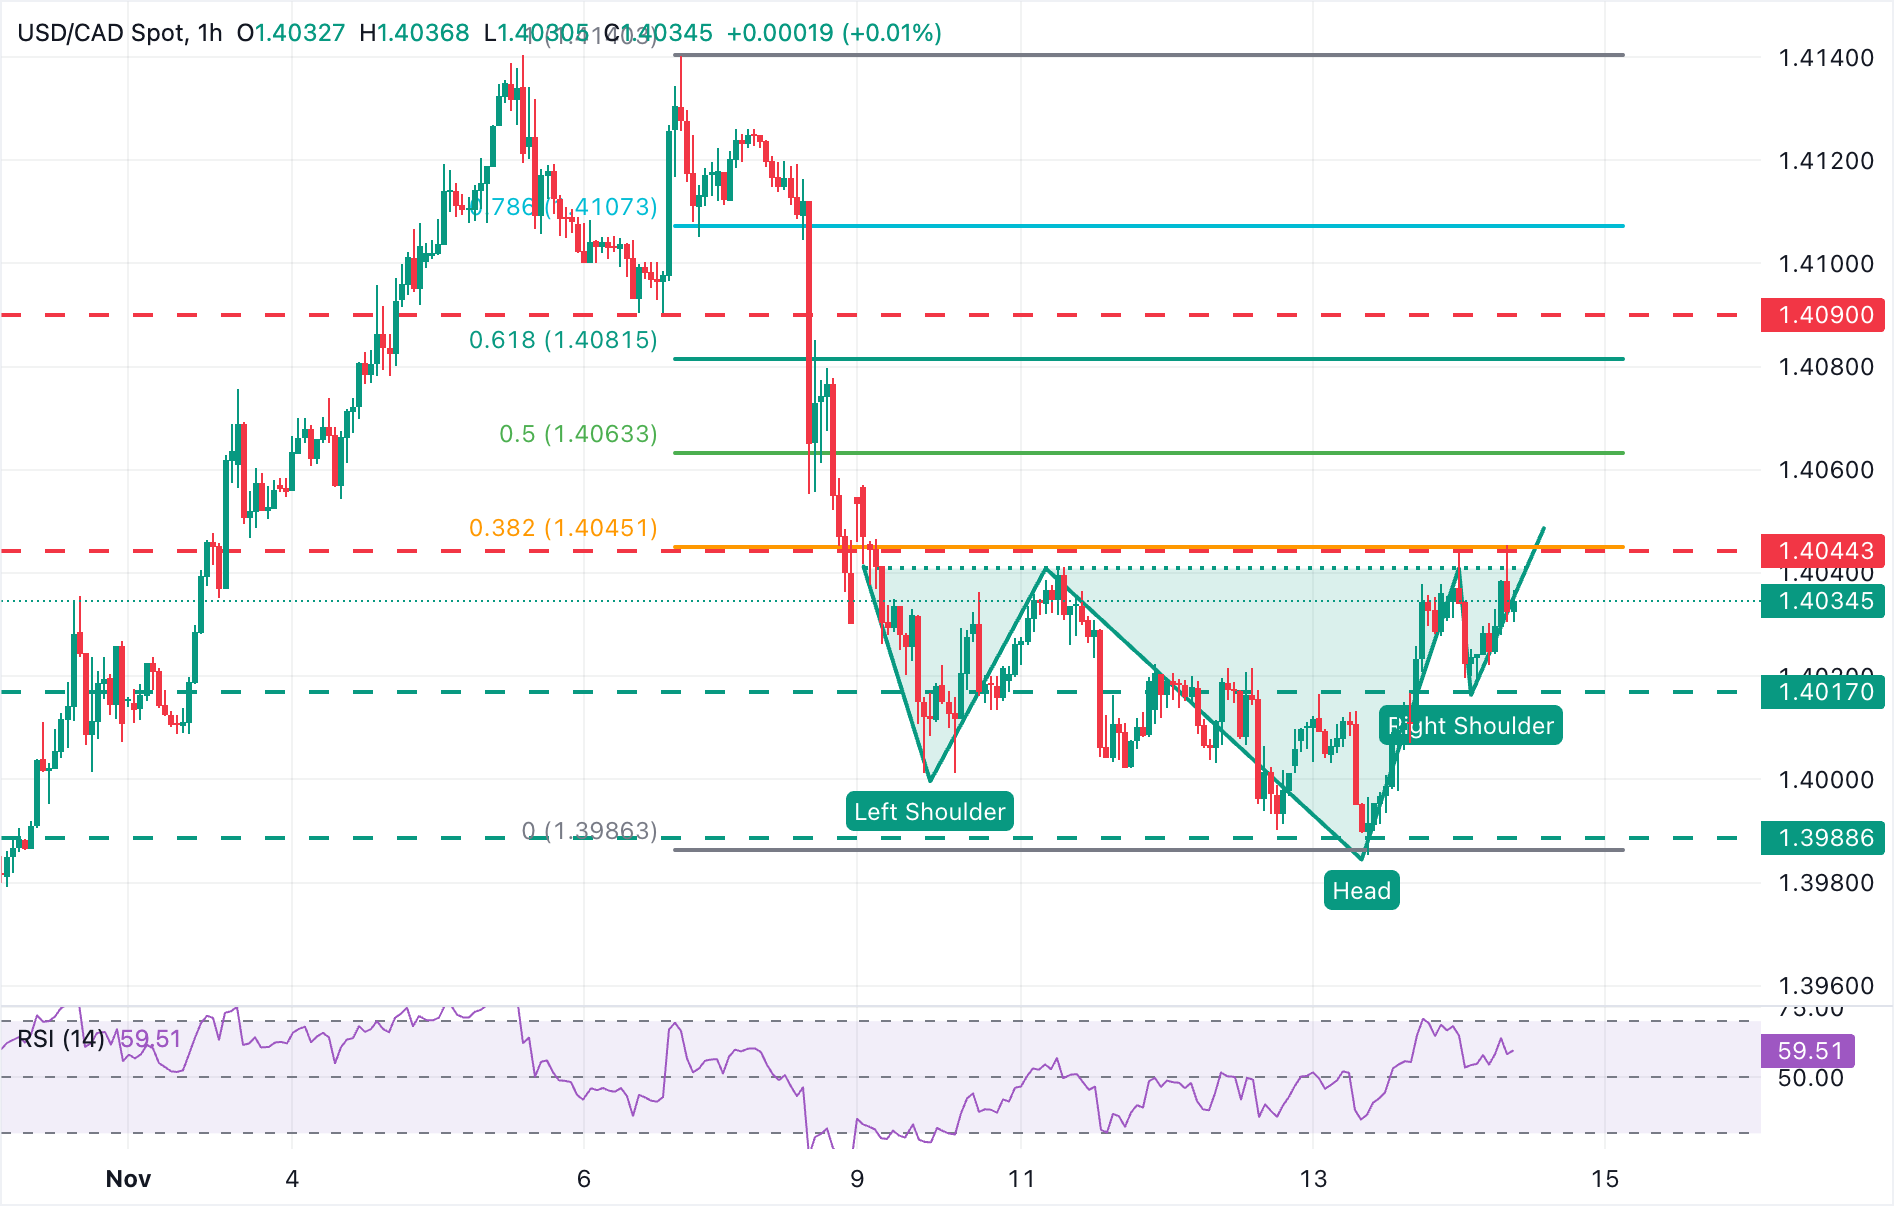
Recent price action suggests that the USD/CAD’s correction from early November highs, at 1.4140, might have been completed, and that the pair is ready to resume the broader bullish trend. A potential bullish “Head & Shoulders’ pattern, a common figure to anticipate trend shifts, endorses that view.
The neckline of the pattern lies at 1.4045, where the intra-day highs meet the 38.6% Fibonacci retracement of the sell-off from the November 6 highs. Further up, the next target lies in the area between the 61.8% retracement of the same bearish cycle, at 1.4080, and the November 6 lows, at 1.4090.
To the downside, the 1.4015-1.4020 area (intraday low, November 12 highs) is holding bears for now and closing the path towards Thursday’s low, at 1.3985. A confirmation below here would increase pressure towards the October 30 low, at 1.3925.
US Dollar FAQs
The US Dollar (USD) is the official currency of the United States of America, and the ‘de facto’ currency of a significant number of other countries where it is found in circulation alongside local notes. It is the most heavily traded currency in the world, accounting for over 88% of all global foreign exchange turnover, or an average of $6.6 trillion in transactions per day, according to data from 2022. Following the second world war, the USD took over from the British Pound as the world’s reserve currency. For most of its history, the US Dollar was backed by Gold, until the Bretton Woods Agreement in 1971 when the Gold Standard went away.
The most important single factor impacting on the value of the US Dollar is monetary policy, which is shaped by the Federal Reserve (Fed). The Fed has two mandates: to achieve price stability (control inflation) and foster full employment. Its primary tool to achieve these two goals is by adjusting interest rates. When prices are rising too quickly and inflation is above the Fed’s 2% target, the Fed will raise rates, which helps the USD value. When inflation falls below 2% or the Unemployment Rate is too high, the Fed may lower interest rates, which weighs on the Greenback.
In extreme situations, the Federal Reserve can also print more Dollars and enact quantitative easing (QE). QE is the process by which the Fed substantially increases the flow of credit in a stuck financial system. It is a non-standard policy measure used when credit has dried up because banks will not lend to each other (out of the fear of counterparty default). It is a last resort when simply lowering interest rates is unlikely to achieve the necessary result. It was the Fed’s weapon of choice to combat the credit crunch that occurred during the Great Financial Crisis in 2008. It involves the Fed printing more Dollars and using them to buy US government bonds predominantly from financial institutions. QE usually leads to a weaker US Dollar.
Quantitative tightening (QT) is the reverse process whereby the Federal Reserve stops buying bonds from financial institutions and does not reinvest the principal from the bonds it holds maturing in new purchases. It is usually positive for the US Dollar.
추천 기사


