

NZD/USD Price Forecast: Resumes upside as US Dollar faces pressure
- NZD/USD jumps higher to near 0.5675 as the US Dollar faces selling pressure.
- Fed dovish bets have receded amid upside inflation risks.
- The RBNZ is expected to cut interest rates again this year.
The NZD/USD pair trades 0.35% higher to near 0.5675 during the European trading session on Friday. The Kiwi pair strengthens as the US Dollar is under pressure amid caution among investors as the United States (US) Bureau of Labor Statistics (BLS) is set to release key economic data soon, which was halted due to the government shutdown.
At the time of writing, the US Dollar Index (DXY), which tracks the Greenback’s value against six major currencies, trades subduedly near its two-week low of 99.00 posted on Thursday.
US Dollar Price Today
The table below shows the percentage change of US Dollar (USD) against listed major currencies today. US Dollar was the weakest against the New Zealand Dollar.
| USD | EUR | GBP | JPY | CAD | AUD | NZD | CHF | |
|---|---|---|---|---|---|---|---|---|
| USD | 0.00% | 0.09% | 0.02% | 0.02% | 0.01% | -0.43% | -0.24% | |
| EUR | -0.00% | 0.09% | 0.00% | 0.02% | 0.00% | -0.43% | -0.24% | |
| GBP | -0.09% | -0.09% | -0.10% | -0.07% | -0.08% | -0.52% | -0.33% | |
| JPY | -0.02% | 0.00% | 0.10% | 0.05% | 0.02% | -0.43% | -0.23% | |
| CAD | -0.02% | -0.02% | 0.07% | -0.05% | -0.02% | -0.45% | -0.26% | |
| AUD | -0.01% | -0.01% | 0.08% | -0.02% | 0.02% | -0.43% | -0.25% | |
| NZD | 0.43% | 0.43% | 0.52% | 0.43% | 0.45% | 0.43% | 0.19% | |
| CHF | 0.24% | 0.24% | 0.33% | 0.23% | 0.26% | 0.25% | -0.19% |
The heat map shows percentage changes of major currencies against each other. The base currency is picked from the left column, while the quote currency is picked from the top row. For example, if you pick the US Dollar from the left column and move along the horizontal line to the Japanese Yen, the percentage change displayed in the box will represent USD (base)/JPY (quote).
On the monetary policy front, traders have trimmed Federal Reserve (Fed) dovish expectations for the December policy meeting as a slew of officials have been stressing to bring above-target inflation down.
Although the New Zealand Dollar (NZD) trades higher against the US Dollar, the Kiwi dollar’s upside is expected to remain limited as the Reserve Bank of New Zealand (RBNZ) is expected to cut interest rates further this year amid weak job demand.
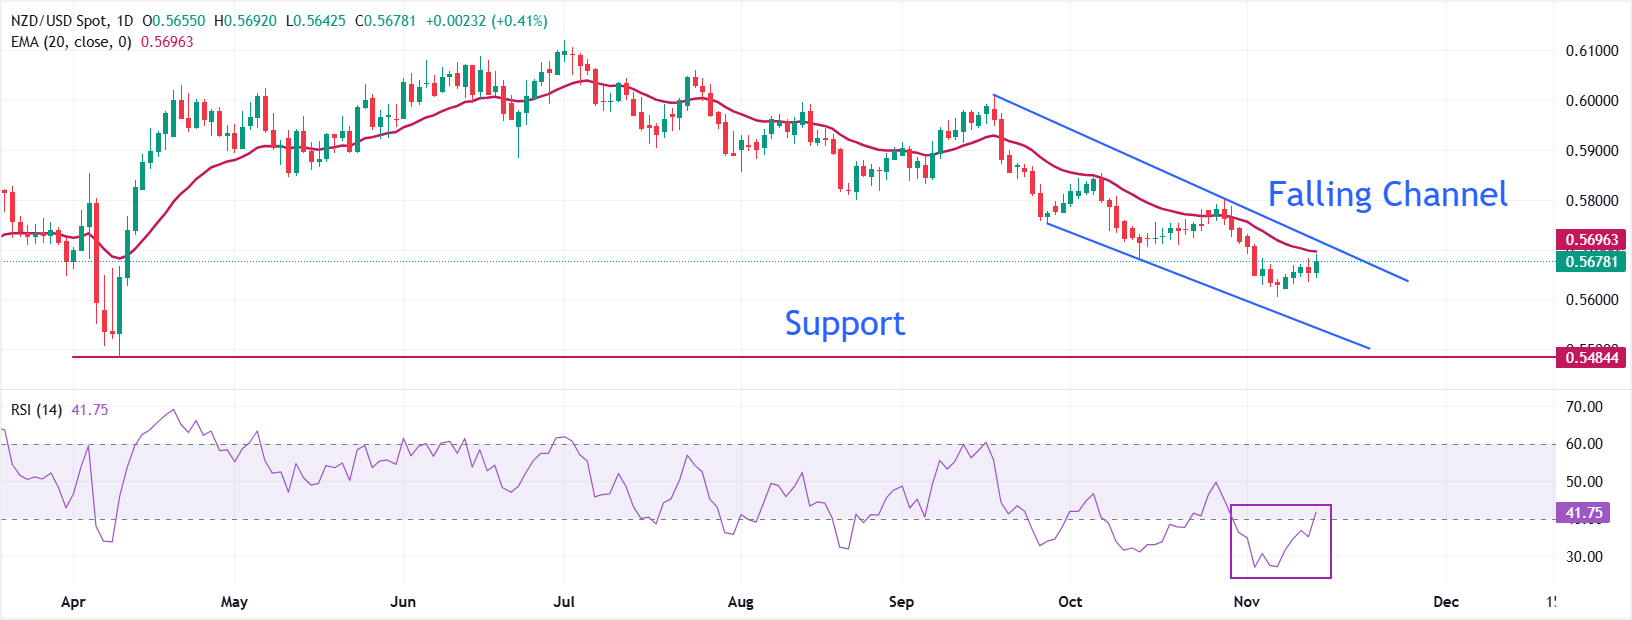
NZD/USD trades in a Falling Channel for two months, suggesting that the overall trend is bearish. The 20-day Exponential Moving Averages (EMA) near 0.5700 has been acting as a key barrier for NZD bulls.
The 14-day Relative Strength Index (RSI) recovers to near 40.00. A fresh bearish momentum would emerge if the RSI reverses below 40.00.
Going forward, the asset could slide towards the round-level support of 0.5600, and the April 9 low of 0.5485 if it breaks below the November 13 low of 0.5635.
In an alternate scenario, the Kiwi pair would rise towards the October 29 high of 0.5800 and the October 7 high of 0.5853 if it manages to break above the November 3 high of 0.5731.
NZD/USD daily chart
New Zealand Dollar FAQs
The New Zealand Dollar (NZD), also known as the Kiwi, is a well-known traded currency among investors. Its value is broadly determined by the health of the New Zealand economy and the country’s central bank policy. Still, there are some unique particularities that also can make NZD move. The performance of the Chinese economy tends to move the Kiwi because China is New Zealand’s biggest trading partner. Bad news for the Chinese economy likely means less New Zealand exports to the country, hitting the economy and thus its currency. Another factor moving NZD is dairy prices as the dairy industry is New Zealand’s main export. High dairy prices boost export income, contributing positively to the economy and thus to the NZD.
The Reserve Bank of New Zealand (RBNZ) aims to achieve and maintain an inflation rate between 1% and 3% over the medium term, with a focus to keep it near the 2% mid-point. To this end, the bank sets an appropriate level of interest rates. When inflation is too high, the RBNZ will increase interest rates to cool the economy, but the move will also make bond yields higher, increasing investors’ appeal to invest in the country and thus boosting NZD. On the contrary, lower interest rates tend to weaken NZD. The so-called rate differential, or how rates in New Zealand are or are expected to be compared to the ones set by the US Federal Reserve, can also play a key role in moving the NZD/USD pair.
Macroeconomic data releases in New Zealand are key to assess the state of the economy and can impact the New Zealand Dollar’s (NZD) valuation. A strong economy, based on high economic growth, low unemployment and high confidence is good for NZD. High economic growth attracts foreign investment and may encourage the Reserve Bank of New Zealand to increase interest rates, if this economic strength comes together with elevated inflation. Conversely, if economic data is weak, NZD is likely to depreciate.
The New Zealand Dollar (NZD) tends to strengthen during risk-on periods, or when investors perceive that broader market risks are low and are optimistic about growth. This tends to lead to a more favorable outlook for commodities and so-called ‘commodity currencies’ such as the Kiwi. Conversely, NZD tends to weaken at times of market turbulence or economic uncertainty as investors tend to sell higher-risk assets and flee to the more-stable safe havens.
추천 기사


