

Profiting From The Golden Cross and Death Cross: Tips and Tricks
For many traders, analyzing the market is no big deal. The problem comes when deciding when and where to enter the trade. What if we tell you there is a way you can determine when the trend is changing? This is where the golden cross and death cross comes in handy.
But to help you understand these two trading signals, let's take a step back and understand what the golden and the death cross mean. In our explanation, we will use the moving averages(MA), MACD, and KD indicators. So let's dive right in.
Understanding the Golden Cross and Death Cross

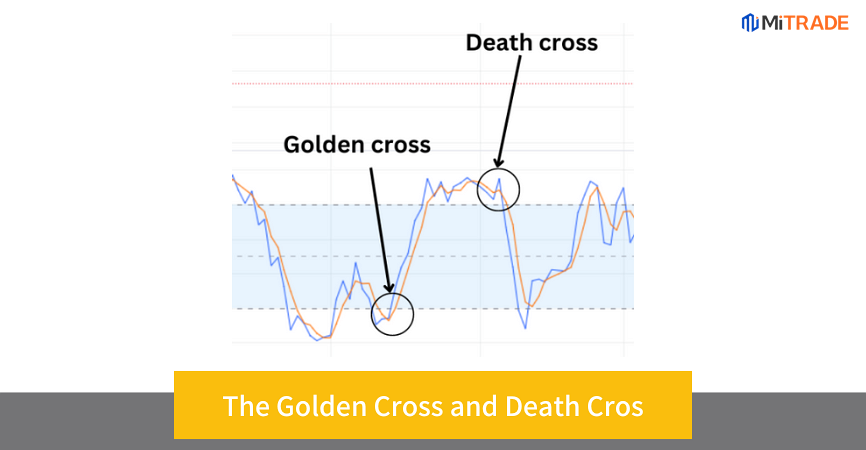
The golden cross signals the beginning of a bright start. In reality, it gives a bullish signal
The death cross spells bad news for an instrument - it gives a bearish signal - well, it's good news for short traders.
The golden cross and the death cross utilize crossovers of two lines, usually moving averages. Remember, in technical analysis, the goal is to determine the general trend, price direction, and change in the market performance.
The short-period averages show the short-term trend, while the long-term averages depict the long-term trend.
For instance, let’s take the moving averages. A typical moving averages pair for golden cross and death is 50 MA and 200 MA. You can also use 10 and 20 exponential moving averages (EMA). The choice depends on your trading strategy. Are you a short-term or long-term trader?
However, long-period MAs tend to give clearer signals. Short-period MAs are prone to market noises which can lead to numerous confusing crossovers.
During a volatile market, the numerous whipsaws can render the crossover signals useless. Ideally, you should match short-term with relatively long-term moving averages. Check when the short-term average crosses the long-term MA.
Either cross signals a change in trend movement, more often used as a confirmation tool rather than a pre-emptive indicator. Both crosses are often used in technical analysis, to analyze the price movements of the cryptocurrency, forex, futures, and stocks.
The Golden Cross
The golden cross occurs when the short-term moving averages cross above the long-term moving average (from below). Essentially, the indicator shows that the short-term moving average is higher than the long-term moving average. The former is more bullish relative to the latter. This gives a bullish signal.
The Death Cross
The death cross occurs when the short-term moving average crosses below the long-term moving average( from above). The longer average is higher than the short-term average. As a result, the crossover gives us a bearish signal.
Now, to help you understand how this training strategy works, let's look at some examples using the MA, KD indicator, and MACD.
Moving Averages Golden Cross and Death Cross

The moving average shows the average transaction price of an instrument over a certain period. It helps you determine the current trend and predict the future movement of the price action.
Let's take an example of the EURUSD pair price action with a 20 EMA and 50 EMA. When the short-term MA (20-day EMA) crosses above the 50 EMA, it creates a golden cross. This indicates that the average price increase in the short term is higher than in the short term. This is a bullish signal for traders to go long.
Similarly, when the 20 EMA crosses below the 50 MA, it means the short-term average price decline is greater than the long-term average. This intersection forms the death cross. The signal indicates that traders should be ready to open short trades.
Golden Cross vs Death Cross: Take MACD As Example

The MACD works pretty much the same way as the moving averages. In fact, it's also referred to as the moving averages of similarities and differences. Like other average indexes, it uses two lines with different speeds. The difference between the average price creates a histogram. Unlike other indicators, the MACD has a fast line, slow line, and histogram.
Fast line - created by calculating the difference between the 12 EMA and the 26 EMA.
Slow line- typically, this line uses the 9-period ema
Histogram- created by calculating the difference between the fast and the slow lines. The difference is shown in the MACD graph as histograms.
Golden Cross
Like in MA, the golden cross occurs when the fast line pierces through and goes above the slow line. The MACD histogram crosses from the negative to the positive side. This is a buy signal for traders, indicating the asset will gain value in the future.
Death Cross
The Death cross occurs when the fast-moving average crosses below the slow moving average. This indicates an impending price decline, which investors interpret as a sell signal. The histogram changes from positive to negative.
Golden Cross vs Death Cross: KD Indicator as an Example

The KD indicator, also known as the stochastic oscillator, is an index average showing price direction. It is used to measure the changes in prices over a certain period. In fact, stochastic means price changes over a period.
The indicator consists of the K line and the D line. The K line is composed of differences between the closing prices and the price range between the highest and lowest price of the period. The D line is the moving average of the K line.
Essentially, the two lines move in the same direction but cross at some points. When the blue line crosses above the red line, it forms a golden cross giving a bullish signal. You can expect the price to move upwards. Similarly, when the blue line crosses below the red line, it forms a death cross. That's a bearish signal suitable for entering a short position.
Why Do We Need a Crossing Indicator To Judge?
Perhaps the main reason why the golden cross and death cross indicator is useful is because of the up-and-down nature of the price movement.
As the market fluctuates due to volatility, determining the right time to enter the market proves to be an uphill task. The moving average smoothens the price action, eliminating the market noise and enabling traders to find a clear market trend.
While the downside is that the smoothing process results in price lag, the price averages provide a clear picture of the long-term price movement. As a result, you can use the golden cross and death cross to determine without much hassle when the trend is changing.
While both the golden and death cross is usually referenced against the moving averages, there can be other methods too, such as; KD indicator against MACD. The whole idea is to have long-term and short-term average indexes and wait for them to intersect. Ideally, when the short-term average index crosses above the long-term average index, it gives a buy signal. The vice versa is true.
What To Know When Using The Golden Cross & Death Cross?
Arguably the death cross and golden cross fall into the lagging indicators group. This is opposed to the leading indicators. This means the indicator forms after the price movement.
To be precise, the golden and death crosses might happen after the market has already formed rather than giving you a trading signal when the market is just about to reverse. This case is more pronounced in moving averages and KD indicators than in the MACD. For this reason, critics argue the indicator is not an incredible tool for analyzing market performance.
Yet another concern is momentum. The indicators may show a change in momentum, but the market could reverse when the traders are about to take advantage of the signal. Therefore, it's common for whipsaws, typical up and downs, reversals, and misjudgment to occur even when the indicator gives clear signals. The fact that the average index posts a cross doesn't necessarily mean the market will follow the trends as a rule of thumb.
That said, you can use the crosses to find ideal trade entry and exit points. In fact, you can go a notch higher and use the indicator to find killer reversal opportunities. In other words, you can use the golden cross to find opportunities where buying pressure overheats and rises sharply. After the massive upwards run, find an excellent opportunity to short the trade. Similarly, a pair may plummet massively after a death cross, providing a perfect opportunity to go long at a discounted price.
The best course of action is to use the indicator in combination with other technical tools to establish confluence. For instance, if the RSI indicator is in an oversold or overbought area, the better.
The Bottom Line
The golden cross and the death cross are straightforward technical tools. While relatively less popular, the trading signals tend to be more accurate, especially when you use long-period moving averages on higher time frames. You can use the crosses to determine when the price trend changes. Conversely, short the currency pair(instrument) when the death cross appears. Similarly, you can use the indicator as an exit strategy. For instance, you can choose to close a short position when the golden cross occurs. signaling a potential upward movement
The ball is now in your court. Backtest this highly useful technical tool and incorporates it into your trading strategy. Then, open a Mitrade account today and start trading. There are myriad other technical tools and education materials to ensure you book more winning trades. You’ll also enjoy tight spreads and zero commissions. Can’t wait to get to winning ways, right? Try Mitrade on mobile or web!

* The content presented above, whether from a third party or not, is considered as general advice only. This article should not be construed as containing investment advice, investment recommendations, an offer of or solicitation for any transactions in financial instruments.

