
Inside SoFi’s Capital-Light Machine
- SoFi generated $771 million in Q1 adjusted net revenue, up 33% YoY, with a record $210 million in EBITDA.
- Fee-based revenues now make up 41% of adjusted net revenue, growing 67% YoY and annualizing at $1.6 billion.
- Member count reached 10.9 million, with 15.9 million total products and 50% of users adopting a second product.
- Net charge-offs declined to 3.31%, with an average borrower FICO of 743, signaling strong underwriting during macro uncertainty.
TradingKey - In a fintech sector marred by implosions and re-ratings, SoFi Technologies (SOFI) is a rare enigma. On face value, its forward multiples are outrageous: a 65x GAAP forward P/E and a non-GAAP trailing P/E of just shy of 103.47, several times the industry median. But underneath these headlining multiples is an ecosystem stealthily compounding fee-based revenues, engineering a transition to a capital-light flywheel, and creating operational leverage even staid banks can only envy.
The question is whether these upside catalysts can compensate for valuation drags implicit in stubbornly high multiples. But understanding SoFi’s asymmetric advantage requires more than a glance at raw numbers and unraveling its strategic position, competitive moat, and real earnings capabilities.
Platform Economics in Action: From Lending First to Ecosystem Monetization
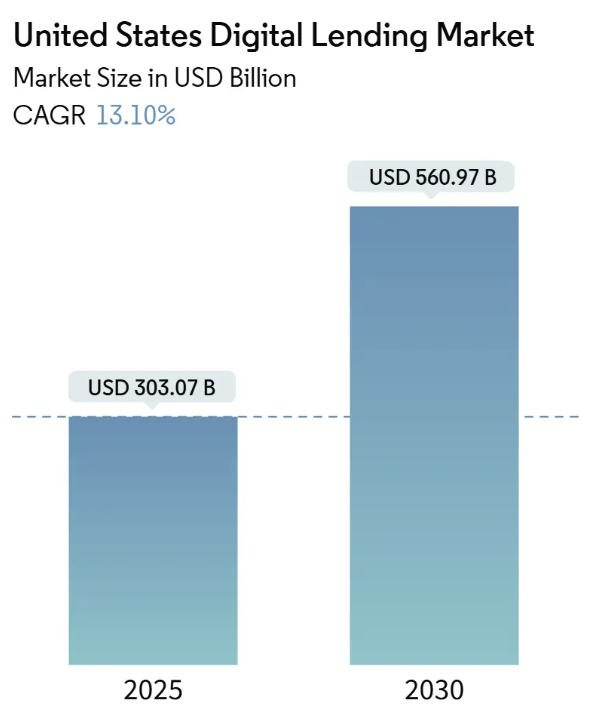
Source: Mondor Intelligence
Its business development is a disciplined transformation from monoline lending to a multi-fee-based online financial center. The once-student-loan-focused lender now earns 41% of adjusted net income from fee-based sources, a 67% year-over-year increase, and is on its way to $1.6 billion annually. This is no cosmetic adjustment. It reveals why SoFi’s Financial Services Productivity Loop (FSPL) naturally lowers customer cost acquisition and lifts its members’ lifetime value.
The Q1 numbers reflect this shift’s momentum: a new quarterly high of $771 million in adjusted net revenue (+33% YoY) and adjusted EBITDA of $210 million with a 27% margin, its best mark in five quarters. Deposit funding, which today represents 90% of SoFi’s funding base, has also gone strategic. It provides the basis for a robust net interest margin of 6% while insulating the balance sheet from credit market volatility. Loan volume, $7.2 billion this quarter, feeds the flywheel, but LPB’s fee-based income provides the margin expansion narrative. Through originating loans on behalf of third parties or selling into asset markets with predictable execution above fair value, SoFi has built an intermutable capital stack upon which to build capital-light recurring fees.
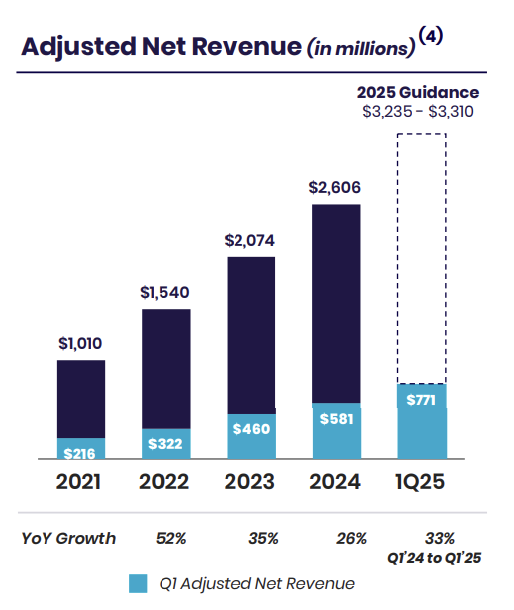
Source: SoFi Investor Presentation Q1 2025
Compete through Differentiation or Commoditization:
Scaling deposits, cross-selling financial products, and reveling in robust credit performance distinguish SoFi from legacy banks and neobank rivals. Its membership has increased beyond 10.9 million, a 34% YoY rise, with 15.9 million products across its lending, investment, and credit card businesses. The FSPL maintains strong customer stickiness. Approximately 50% of members buy another product within a year, extracting the incremental cost of marketing and growing wallet share.
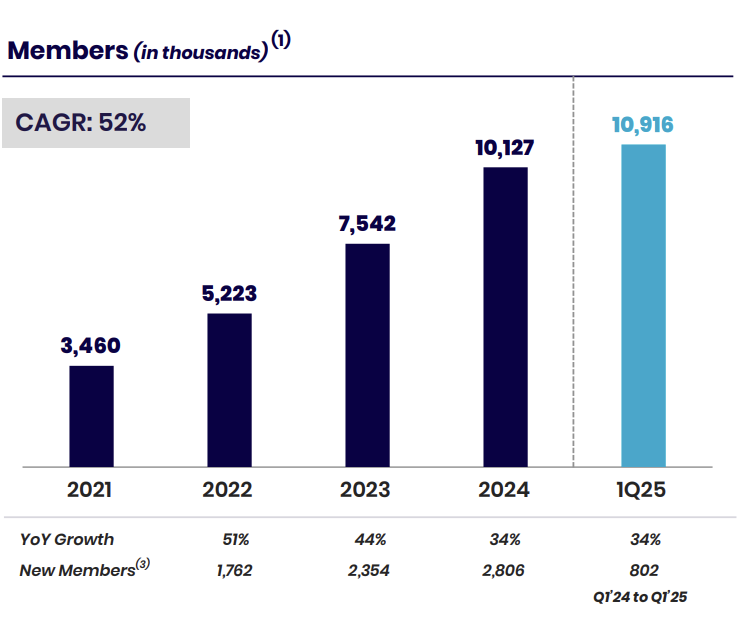
Source: SoFi Investor Presentation Q1 2025
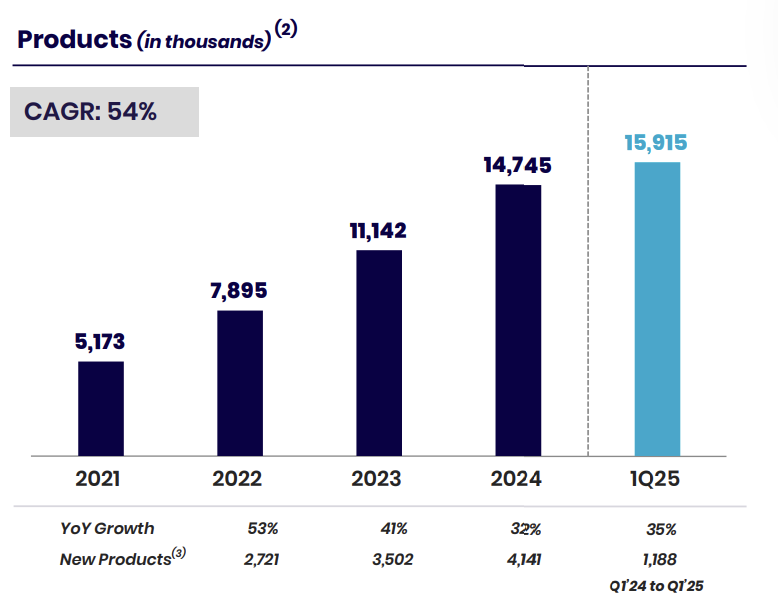
Source: SoFi Investor Presentation Q1 2025
However, there is still no mercy in the competitive environment. Incumbents like JP Morgan Chase and local banks have responded with overlays on top of their digital foundations, and startups like Chime and Varo jam the neobank market. The key differentiator for SoFi is its banking charter. Since 2022, this has enabled it to accumulate high-quality deposits and compete on rate without capital restrictions that haunt neobanks that use partner banks or sweep accounts. Meanwhile, its tech stack modestly supports 158 million third-party end-user accounts and opens a subtle B2B revenue doorway that can grow further as embedded finance takes hold.
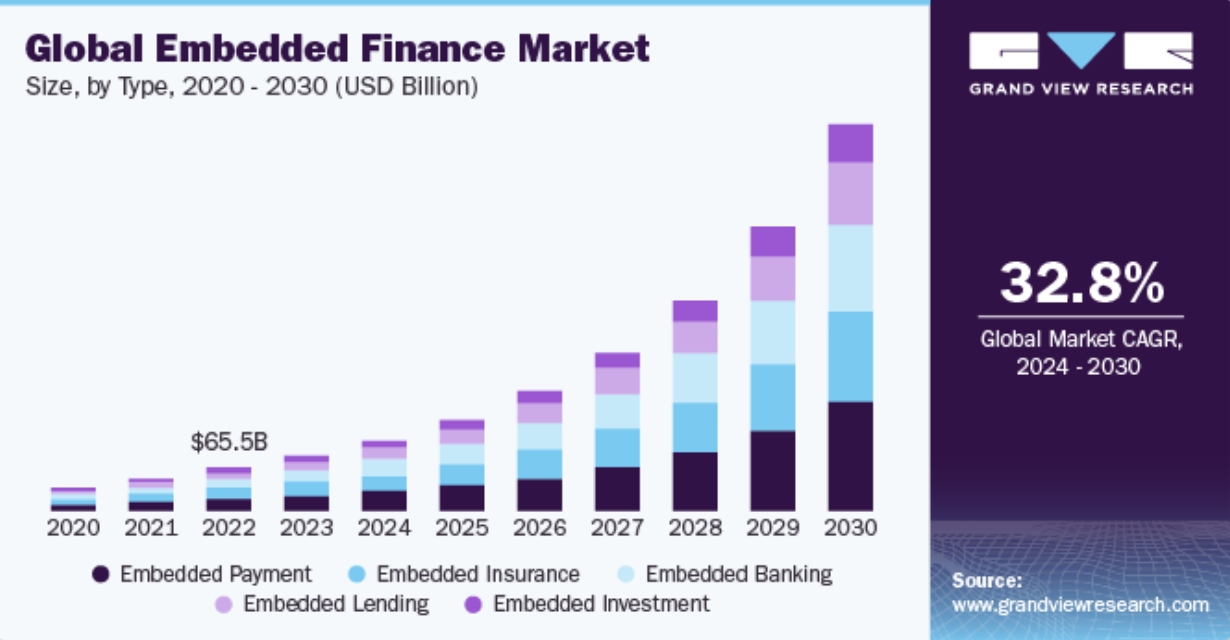
Source: Grand View Research
It can develop cracks if customer acquisition cost spikes materially or if non-core business units do not merit reinvestment. While SoFi's unaided awareness is growing (7%), its heavy marketing costs and sports sponsorships need to yield a tangible improvement in fee-based monetization. If sustained cross-sell velocity does not follow, the ecosystem benefit can evaporate and pull its premium multiples down.
The Financial Core: Cash Flows, Margins, and Unit Economics
Beneath strong top-line growth is a company failing to translate momentum into sustainable free cash flow. SoFi's net income hit $71 million in Q1 with a 9% GAAP margin, its sixth straight quarter of profitability. Adjusted EPS was $0.06, in line with incremental EBITDA margin improvement.
Fee-based revenue, 41% of adjusted net revenue, is a positive indicator for improved earnings quality, but the question is whether this mix shift can sustain valuation gravity. Its capital-light Loan Platform business is a significant lever. Origination loans to institutional accounts like Blue Owl and Fortress allow SoFi to keep upfront and ongoing fees and shift balance sheet risk. Recent execution reflects personal loan sales execution consistently above fair value, with a first securitization of the SCLP being another validation of its playbook in capital markets.
Still, cost discipline should be sustained. Operating cost leverage has improved, but SoFi's overhead is susceptible to marketing investment and innovation costs. Without judicious reinvesting, its FSPL flywheel can be undermined. Moreover, in this valuation snapshot, there is a notable gap: while price-to-book is 3.01, a rich 153% premium compared with peers, tangible book value is $5.1 billion and growing roughly $1 billion YoY. Such growth helps cushion the premium partway, but by no means does it obliterate its entirety.
Valuation Tension: Premium or Pipe Dream?
That’s where SoFi’s narrative meets cold math, but the meeting isn’t as lethal as headline multipliers would have you believe. The 103.47x trailing non-GAAP P/E and above 65x forward P/E screams overvaluation relative to a sector median of around 11.5x. But these snapshots ignore its intrinsic option value of its capital-light growth and transition to fee-based revenues, both of which significantly skew its earnings future.
Fee-based revenues, 41% of adjusted net revenues today and compounding 67% year-over-year, represent a forward run rate annualizing at $1.6 billion. If SoFi sustains this cadence and hits its 2025 guide of $875–$895 million in adjusted EBITDA on incremental EBITDA margins in the 30% range, its implied free cash flow could conservatively reach $500–$600 million on a two-year basis after normalizing growth reinvestment and non-cash adjustments.
A capital-light fintech with cross-sell flywheels and stable deposit funding can support a 35–40x FCF multiple, especially when peers like Block and Nubank, with corresponding ecosystem optionality, trade within that range during periods of improved risk appetite. This translates to an enterprise value range from $20 billion to $24 billion. Adjusting for debt and adding back the tangible book value of $5.1 billion, equity value converges at $22–$25 billion. Divided through ~1.1 billion diluted shares, the base-case valuation settles between $20 and $23 per share.
Essentially, that estimate is not based on linear growth in loan origination but on the sustainability of scaling fee-based revenues faster than lending. If SoFi stumbles on converting new members to multi-product usage, the foundation for FSPL, this $20 anchor, will decay back down toward typical bank multiples. But if its operating leverage and cost of deposit benefit hold their ground, this premium is less about speculating and more about structural monetization power that can't be matched by legacy banks at identical unit cost.
Risks: Credit Cycles, Regulatory Headwinds, and Dilution
Even high-quality flywheels can jam. SoFi’s exposure to consumer credit trends, specifically personal loan quality, remains a firsthand risk factor. While Q1 net charge-offs fell to 3.31% from 3.37% and the FICO borrower mix remains strong at 743 on average, a macroeconomic slump can test this underwriting strength. Another risk is changes in regulation. Any adverse reinterpretation of bank charter benefits or deposit insurance designs can shrink SoFi’s cost advantage.
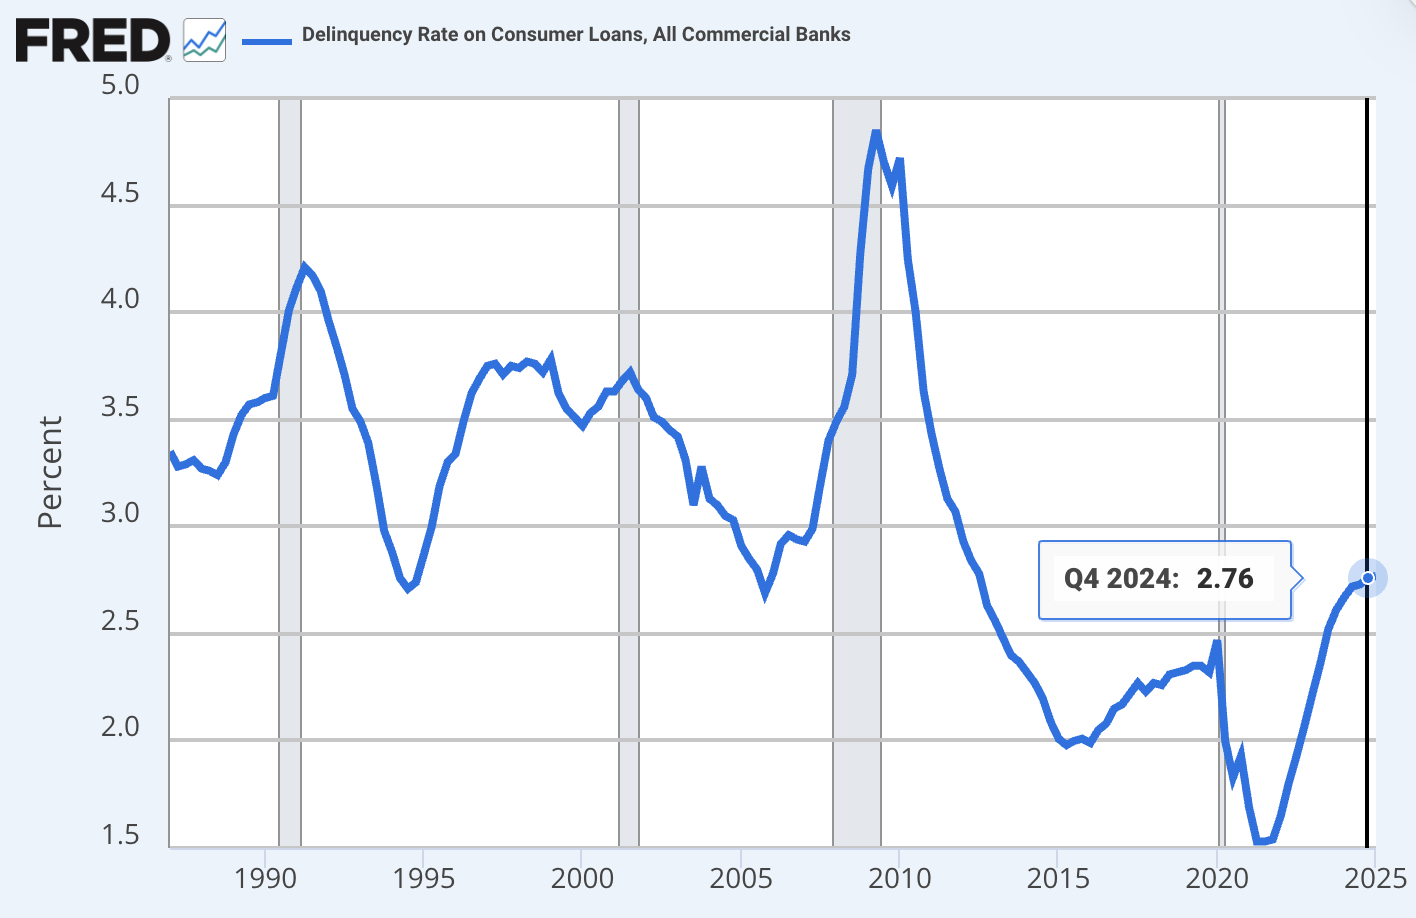
Source: Federal Reserve
In addition, reliance on non-GAAP adjustments obliges investors to monitor dilution. The valuation premium isn't worth share-based compensation, or growth on the balance sheet surrenders real earnings compounding. While tangible book is expanding, successive equity raises or debt conversions at these multiples can deflate per-share value.
Conclusion
SoFi is a high-beta, capital-lite fintech prototype that is only starting to show robust earnings leverage. But conviction in its platform economics will be tested by predictable growth in fee-based revenues, expanding cross-sell ratios, and cushioned balance sheet capacity to absorb shocks without dilutive costs. For institution allocators today, the stock is too costly, but for those willing to consider its long-term trajectory of ecosystem monetization, SoFi offers a risky but compelling asymmetry.

Get Started
Recommended Articles


