

VIX Off Its Highs — Is a U.S. Market Rebound Taking Shape?
TradingKey - The Cboe Volatility Index (VIX), widely regarded as Wall Street’s "fear gauge," has dropped sharply after briefly surging above 50 last week. It has since pulled back to the 30 range. U.S. Treasury Secretary Scott Besant said in an interview this week that the VIX "may have topped out." His view is echoed by market research firm Bespoke Investment Group, which noted that it believed the worst of the selling might already be over.
Meanwhile, BTIG technical strategist Jonathan Krinsky pointed to the expiration of the April VIX futures contract on Wednesday as “a fulcrum for risk.” He added, “We find that the inflection is often inverse to the prior period's volatility performance,” suggesting that volatility could ease further in the coming weeks.
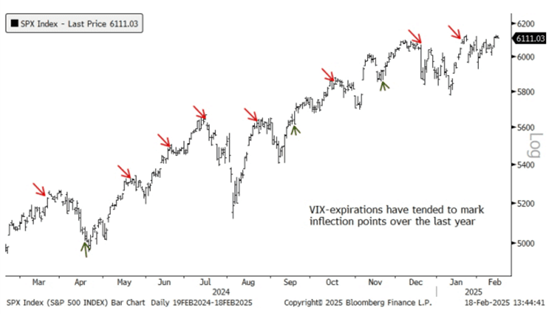
Source: MarketWatch
However, it's worth noting that uncertainty is likely to remain a dominant narrative in the near term. Since early April, the VIX has remained above 30 — well above its long-term average near 20 — indicating that investor sentiment may still be fragile. Darrell Cronk, Chief Investment Officer at Wells Fargo, noted that global trade reforms were still in early stages and that the tariff pause, while helping to stabilize markets, had also extended uncertainty.
President Trump didn’t offer much of an update on tariffs this past week, only mentioning a few times that talks with Japan and the EU were “making major strides.” Meanwhile, China is also holding discussions with its trade partners, but where U.S.-China trades are still isn’t clear.
High Volatility, Low Returns?
While the VIX generally moves inversely to the S&P 500 index, recent trend has raised questions. The volatility index has fallen significantly — from 50 to 30 — but equity markets have yet to fully recover lost ground.
When uncertainty or fear picks up, investors tend to dump stocks and turn to put options to hedge their risk. That drives up implied volatility — which in turn pushes the VIX higher. Conversely, When the market is more stable and stocks are rising, investor fear tends to fade — and the VIX drops as a result. But a falling VIX doesn’t always mean stocks are about to rally. What’s happening in the broader economy still plays a big role.
Take what happened back in mid-February. the VIX fell from a high of around 25 to about 18. A similar dynamic is playing out again: despite the VIX declining from 50 to 30, the S&P 500 has so far regained only around half of its earlier losses. If concerns over the AI trade grow, expensive tech stocks may face renewed pressure—potentially pushing the market into a “high-volatility, low-return” mode where anxiety remains high but gains are limited.
A Peak in Fear — A Signal to Buy?
Interestingly, though the VIX is often viewed as a short-term sentiment gauge, extreme volatility spikes have historically served as buying opportunities for long-term investors.
After looking at past spikes in the VIX—from jumps of 63% all the way up to 176% since 2014—Charlie Bilello, Chief Market Strategist at Creative Planning, found that the S&P 500 gained an average of 4.4% one year later, and a solid 10.2% over five years. As he put it, “High volatility and fear often equal opportunity.”
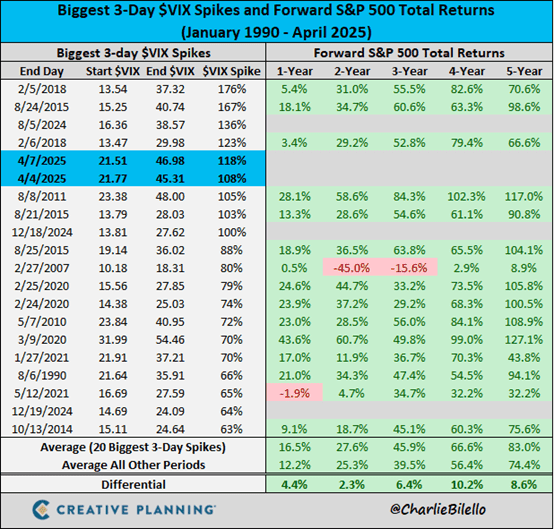
Source: X (@Charlie Bilello)
Likewise, Jason Goepfert of White Oak Consultancy dug into the data and spotted a pattern: every time the VIX dropped from above 50 to around 30, the S&P 500 ended the year in positive territory. After the last time that happened—in May 2020—the market went on to rally 42.96% over the following year.
Recommended Articles


