Prediction: This AI Stock Could Be the Next $4 Trillion Company in 2026

Source The Motley Fool

Key Points

  • Alphabet's market cap has come out of nowhere to surpass Microsoft's.

  • Massive investments in its technology and the release of Gemini 3 have dramatically changed perceptions about the Google parent.

  • Alphabet has the second-lowest P/E ratio in the "Magnificent Seven."

  • 10 stocks we like better than Alphabet ›

Many investors were shocked when Nvidia became the first company to achieve a $4 trillion market cap. The competition for the world's largest market cap was long a contest between Apple and Microsoft, so to see Nvidia emerge out of nowhere likely came as a surprise.

Now, the question is, which company is the next to achieve a $4 trillion market cap? Today, Apple has already achieved that, but instead of Microsoft (which previously reached that point before retreating), I believe another emerging company will be the next one to reach this milestone. Here's why.

Where to invest $1,000 right now? Our analyst team just revealed what they believe are the 10 best stocks to buy right now. Continue »

Shot of Google doodle book.

Image source: Alphabet.

The next $4 trillion company

Today, the stock most likely to reach $4 trillion and stay above that point is Alphabet (NASDAQ: GOOGL) (NASDAQ: GOOG). Currently, its market cap is at $3.7 trillion, surpassing Microsoft's current $3.5 trillion market cap.

That choice may come as a surprise to some investors. As recently as spring 2025, the Google parent's market cap was under $2 trillion.
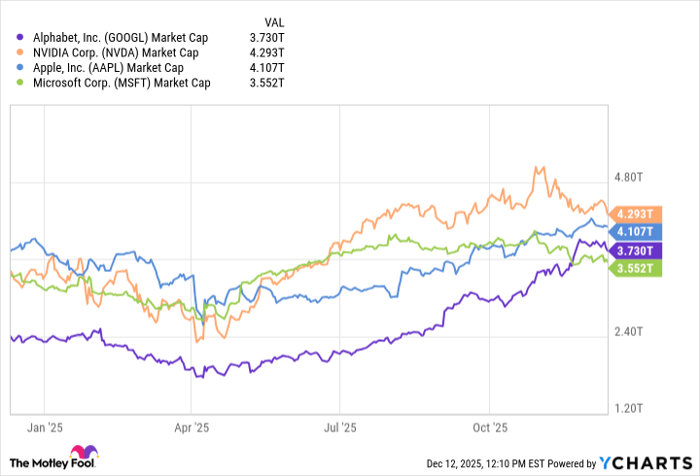
GOOGL Market Cap Chart

Data by YCharts.

Alphabet stock had long been smaller than many of its "Magnificent Seven" peers, as the rise of ChatGPT weighed on the stock. When GPT-4 came out in 2023, investors soured on Google Search, and its market share had fallen below 90% for the first time in decades.

At that point, not only did ChatGPT offer more thorough and concise results, but it bypassed the advertising ecosystem that had long served as the primary source of the Google parent's revenue.

The company released Google Gemini later that year. Still, Gemini did not initially stand out from the likes of Claude, Grok, Copilot, and numerous other AI platforms trying to unseat ChatGPT.

Also, investors should remember that Alphabet has long worked to reduce its dependence on advertising for revenue. In recent years, Google Cloud has claimed an increasing share of the revenue. Still, even though Alphabet was an early pioneer in artificial intelligence (AI), these efforts did not seem to impress investors.

What changed?

However, Alphabet has long benefited from a massive level of liquidity and considerable free cash flows. In late 2024, it pledged to spend $75 billion on capital expenditures (capex) in 2025, later raising that to the $91 billion-$93 billion range.

Much of that spending has gone into improving legacy products. Search now incorporates AI-driven results, and Google Cloud offers upgraded infrastructure, multimodality AI models, and new tools for developers. Additionally, AI should help to make Waymo a source of revenue as it seeks to compete in the autonomous driving space.

Nonetheless, it seems to be the release of Gemini 3 in November that has captured the most attention recently. With improved reasoning, coding, and multimodal understanding, some analysts claim it is "better than ChatGPT."

With that, the stock is up more than 60% over the last year, and more than 110% from its April low. Not surprisingly, almost half of that increase has occurred since October.

Moreover, despite these gains, it is the second-cheapest Magnificent Seven stock. Its P/E ratio of around 30 is undercut only by Meta Platforms, a stock trading at 28 times earnings. That comparative discount could give investors all the more reason to continue buying stock in the Google parent.
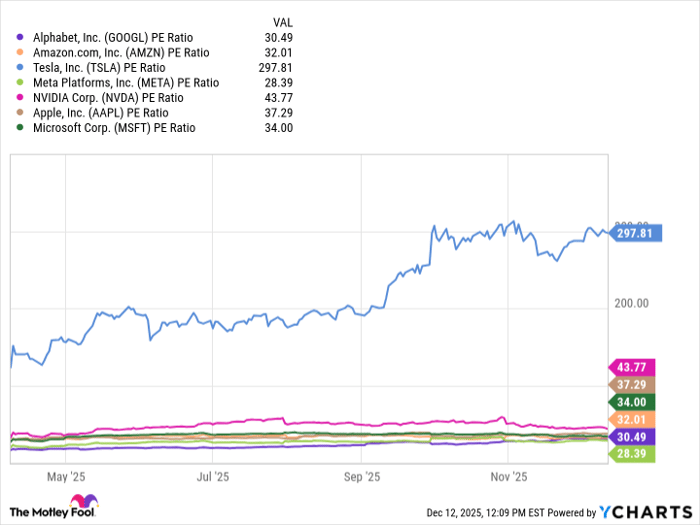
GOOGL PE Ratio Chart

Data by YCharts.

Alphabet at $4 trillion (and beyond)

Between the relatively low valuation and the newfound success of Gemini 3, Alphabet appears likely to reach $4 trillion next.

Ultimately, investors like winners in cutting-edge technologies, and amid Alphabet's massive investments, having Gemini 3 perceived as "better than ChatGPT" positions Alphabet stock for higher moves.

Additionally, the AI pioneer is aggressively applying the technology to Google Cloud, and its efforts with Waymo could begin to bear fruit soon. As investors notice the stock as undervalued relative to peers, it continues to benefit from numerous tailwinds.

Amid such successes, Alphabet may not only reach $4 trillion, but could challenge Apple and Nvidia for the world's largest market cap.

Should you buy stock in Alphabet right now?

Before you buy stock in Alphabet, consider this:

The Motley Fool Stock Advisor analyst team just identified what they believe are the 10 best stocks for investors to buy now… and Alphabet wasn’t one of them. The 10 stocks that made the cut could produce monster returns in the coming years.

Consider when Netflix made this list on December 17, 2004... if you invested $1,000 at the time of our recommendation, you’d have $509,955!* Or when Nvidia made this list on April 15, 2005... if you invested $1,000 at the time of our recommendation, you’d have $1,089,460!*

Now, it’s worth noting Stock Advisor’s total average return is 968% — a market-crushing outperformance compared to 193% for the S&P 500. Don't miss the latest top 10 list, available with Stock Advisor, and join an investing community built by individual investors for individual investors.

See the 10 stocks »

*Stock Advisor returns as of December 17, 2025.

Will Healy has no position in any of the stocks mentioned. The Motley Fool has positions in and recommends Alphabet, Amazon, Apple, Meta Platforms, Microsoft, Nvidia, and Tesla. The Motley Fool recommends the following options: long January 2026 $395 calls on Microsoft and short January 2026 $405 calls on Microsoft. The Motley Fool has a disclosure policy.

Disclaimer: For information purposes only. Past performance is not indicative of future results.
placeholder
Gold Price Forecast: XAU/USD drifts higher above $4,200 as Fed delivers expected cutGold price (XAU/USD) gains momentum to around $4,235 during the early Asian session on Thursday. The precious metal extends its upside after the US Federal Reserve (Fed) delivered an expected third consecutive interest rate cut and maintained its outlook for just one cut in 2026.
Author  FXStreet
Dec 11, Thu
Gold price (XAU/USD) gains momentum to around $4,235 during the early Asian session on Thursday. The precious metal extends its upside after the US Federal Reserve (Fed) delivered an expected third consecutive interest rate cut and maintained its outlook for just one cut in 2026.
placeholder
Ethereum Price Slips Lower — $3,000 Looms as the Key BattlegroundEthereum is attempting to recover from a $3,026 low but remains below $3,200 and the 100-hour SMA, with a bearish trend line near $3,175 capping rebounds as bulls need a clean break above $3,200 to target $3,250–$3,400, while a drop below $3,050 risks a retest of $3,000 and $2,940.
Author  Mitrade
Dec 15, Mon
Ethereum is attempting to recover from a $3,026 low but remains below $3,200 and the 100-hour SMA, with a bearish trend line near $3,175 capping rebounds as bulls need a clean break above $3,200 to target $3,250–$3,400, while a drop below $3,050 risks a retest of $3,000 and $2,940.
placeholder
Bitcoin Slides 5% as Sellers Lean In — Can BTC Reclaim $88,000?Bitcoin has dropped back below $88,000 after rolling over from $90,500, with price still trading under the 100-hour Simple Moving Average. The sell-off found a floor at $85,151, and BTC is now consolidating near that base, but rebounds are facing pressure from a bearish trend line around $89,000. Bulls need to retake $88,000–$89,000 to ease downside risk; failure to do so keeps $85,500–$85,000 and then $83,500 in play, with $80,000 as the deeper “line in the sand.” Bitcoin (BTC) is back in damage-control mode after a sharp pullback wiped out recent gains. The price failed to reclaim the $90,000–$90,500 band, rolled over, and slid through $88,500 before briefly dipping under $87,000. Buyers did show up around $85,000, but the rebound so far looks more like stabilization than a clear trend reversal. Bitcoin dips hard, finds a bid near $85,000(h3) BTC’s latest move lower began when it couldn’t build follow-through above $90,000 and $90,500. Once that upside stalled, sellers took control and pushed price down through $88,500. The slide accelerated enough to spike below $87,000, but the market didn’t free-fall. Bulls defended the $85,000 zone, printing a low at $85,151. Since then, Bitcoin has been consolidating below the 23.6% Fibonacci retracement of the drop from the $93,560 swing high to the $85,151 low — a clue that the bounce is still shallow and that sellers haven’t fully backed off yet. Structurally, BTC is still on the back foot: It’s trading below $88,000, and It remains below the 100-hour Simple Moving Average, keeping short-term trend pressure pointed downward. Resistance is layered, and $89,000 is the problem area(h3) If bulls try to turn this into a recovery, they’ll have to climb through multiple ceilings in quick succession. First, BTC faces resistance around $87,150, followed by a more meaningful barrier near $87,500. From there, the market’s attention snaps back to $88,000 — the level BTC just lost and now needs to reclaim. A close back above $88,000 would improve the tone, but it doesn’t solve the bigger issue: there’s a bearish trend line on the hourly BTC/USD chart (Kraken feed) with resistance near $89,000, which also lines up with the next technical hurdle. If BTC can push through $89,000 and hold, the rebound could extend toward $90,000, with follow-through targets at $91,000 and $91,500. But until price clears that $88,000–$89,000 zone, rallies are at risk of being sold rather than chased. If BTC fails to reclaim resistance, the downside path is clear(h3) The near-term bear case is simple: if Bitcoin can’t climb back above the $87,000 area and keep traction, sellers may attempt another leg lower. Support levels line up like this: Immediate support: $85,500 First major support: $85,000 Next support: $83,500 Then $82,500 in the near term Below that, the major “don’t break this” level is still $80,000. If BTC slips under $80,000, the risk of acceleration to the downside increases significantly — not because it’s magic, but because it’s the kind of psychological and structural level that tends to trigger forced de-risking. Indicators: momentum still leans bearish(h3) The intraday indicators aren’t offering much comfort yet: Hourly MACD is losing pace in the bearish zone. Hourly RSI remains below 50, suggesting sellers still have the upper hand on short timeframes. So while the $85,000 defense held for now, the market hasn’t flipped bullish — it’s just stopped bleeding.
Author  Mitrade
Dec 16, Tue
Bitcoin has dropped back below $88,000 after rolling over from $90,500, with price still trading under the 100-hour Simple Moving Average. The sell-off found a floor at $85,151, and BTC is now consolidating near that base, but rebounds are facing pressure from a bearish trend line around $89,000. Bulls need to retake $88,000–$89,000 to ease downside risk; failure to do so keeps $85,500–$85,000 and then $83,500 in play, with $80,000 as the deeper “line in the sand.” Bitcoin (BTC) is back in damage-control mode after a sharp pullback wiped out recent gains. The price failed to reclaim the $90,000–$90,500 band, rolled over, and slid through $88,500 before briefly dipping under $87,000. Buyers did show up around $85,000, but the rebound so far looks more like stabilization than a clear trend reversal. Bitcoin dips hard, finds a bid near $85,000(h3) BTC’s latest move lower began when it couldn’t build follow-through above $90,000 and $90,500. Once that upside stalled, sellers took control and pushed price down through $88,500. The slide accelerated enough to spike below $87,000, but the market didn’t free-fall. Bulls defended the $85,000 zone, printing a low at $85,151. Since then, Bitcoin has been consolidating below the 23.6% Fibonacci retracement of the drop from the $93,560 swing high to the $85,151 low — a clue that the bounce is still shallow and that sellers haven’t fully backed off yet. Structurally, BTC is still on the back foot: It’s trading below $88,000, and It remains below the 100-hour Simple Moving Average, keeping short-term trend pressure pointed downward. Resistance is layered, and $89,000 is the problem area(h3) If bulls try to turn this into a recovery, they’ll have to climb through multiple ceilings in quick succession. First, BTC faces resistance around $87,150, followed by a more meaningful barrier near $87,500. From there, the market’s attention snaps back to $88,000 — the level BTC just lost and now needs to reclaim. A close back above $88,000 would improve the tone, but it doesn’t solve the bigger issue: there’s a bearish trend line on the hourly BTC/USD chart (Kraken feed) with resistance near $89,000, which also lines up with the next technical hurdle. If BTC can push through $89,000 and hold, the rebound could extend toward $90,000, with follow-through targets at $91,000 and $91,500. But until price clears that $88,000–$89,000 zone, rallies are at risk of being sold rather than chased. If BTC fails to reclaim resistance, the downside path is clear(h3) The near-term bear case is simple: if Bitcoin can’t climb back above the $87,000 area and keep traction, sellers may attempt another leg lower. Support levels line up like this: Immediate support: $85,500 First major support: $85,000 Next support: $83,500 Then $82,500 in the near term Below that, the major “don’t break this” level is still $80,000. If BTC slips under $80,000, the risk of acceleration to the downside increases significantly — not because it’s magic, but because it’s the kind of psychological and structural level that tends to trigger forced de-risking. Indicators: momentum still leans bearish(h3) The intraday indicators aren’t offering much comfort yet: Hourly MACD is losing pace in the bearish zone. Hourly RSI remains below 50, suggesting sellers still have the upper hand on short timeframes. So while the $85,000 defense held for now, the market hasn’t flipped bullish — it’s just stopped bleeding.
placeholder
December Santa Claus Rally: New highs in sight for US and European stocks?Historical data show a rising trend of US and European stocks in December. If the momentum is strong, fund managers may rush in with a buying frenzy.
Author  Mitrade
Yesterday 02: 50
Historical data show a rising trend of US and European stocks in December. If the momentum is strong, fund managers may rush in with a buying frenzy.
placeholder
XRP’s Price Action Flashes a Warning Even as ETF Flows Stay PositiveXRP’s structure remains weak despite 18 straight positive closes in spot XRP ETFs, with analysts warning that $1.98 and other nearby resistance zones could cap rebounds unless the YO region is reclaimed, while deeper downside scenarios keep $1.53 on watch as a potential (not guaranteed) accumulation area.
Author  Mitrade
Yesterday 06: 37
XRP’s structure remains weak despite 18 straight positive closes in spot XRP ETFs, with analysts warning that $1.98 and other nearby resistance zones could cap rebounds unless the YO region is reclaimed, while deeper downside scenarios keep $1.53 on watch as a potential (not guaranteed) accumulation area.
goTop
quote