
US Dollar retreats slightly ahead of Nonfarm Payrolls release
- The US Dollar trades slightly lower after news of further easing in tariff-related fears ahead of the key Nonfarm Payrolls release.
- China said it considers starting tariff negotiations with the Trump administration.
- The US Dollar Index remains capped below 100.00 ahead of key US data.
The US Dollar Index (DXY), which tracks the performance of the US Dollar (USD) against six major currencies, is seeing some rejection and heads back to 99.75 at the time of writing on Friday after a false break above the 100-marker. The Greenback is softening a touch on the back of headlines that China is considering to start tariff negotiations with the Trump administration. As markets navigate news of trade negotiations, they are still eagerly awaiting the real first official trade deal.
Regarding the Ukraine-Russia war, the mineral deal between the US and Ukraine was signed, a much smaller one in terms of capital potential for the United States and not military guarantees for Ukraine whatsoever, Bloomberg reported.
On the economic calendar front, the focus heads to the Nonfarm Payrolls (NFP) release for April. Expectations are still for a positive print, with the lowest estimate coming in at 50,000 and the highest estimate at 171,000. That means any print below the 50,000 number could be enough to send the DXY lower, while a number above 171,000 could see ample amount of US Dollar strength.
Daily digest market movers: Asian trade talks and NFP
- Japanese Finance Minister Katsunobu Kato said this Friday that the Japanese holdings of US debt are a tool for negotiating with the Trump administration, explicitly raising for the first time its leverage as a massive creditor to the United States in its negotiations, Reuters reported.
- In a Friday statement, China’s Commerce Ministry said that it had noted senior US officials repeatedly expressing their willingness to talk to Beijing about tariffs, and urged officials in Washington to show “sincerity” toward China. The ministry added “the US has recently sent messages to China through relevant parties, hoping to start talks with China,” and “China is currently evaluating this”, Bloomberg reports.
- At 12:30 GMT, the Nonfarm Payrolls report will be published:
- The Payrolls print is expected to come in at 130,000 against the previous 228,000.
- The Unemployment rate is expected to remain stable at 4.2%.
- Monthly Average Hour Earnings are expected to grow at a steady pace of 0.3%.
- Equities in Europe have taken over the positive tone and are up over 1% on the day. US equity futures look more sluggish.
- The CME FedWatch tool shows the chance of an interest rate cut by the Federal Reserve in May's meeting stands at 7.6% against a 92.4% probability of no change. The June meeting sees a 65.1% chance of a rate cut. Should Nonfarm Payrolls be a big beat on the estimated number, expect rate cut expectations to be unwound, while a miss might see rate cut expectations for June and even May soar.
- The US 10-year yields trade around 4.21%, erasing past weeks’ softening as traders look for clues on potential rate cut projections from the Federal Reserve.
US Dollar Index Technical Analysis: Time to break or reject?
The US Dollar Index (DXY) is at a key technical level this Friday, brought there after a three-day winning streak. The Nonfarm Payrolls release could be the key here for this Friday, with a continuation from the past three days and a firm break above the 100-handle. Still, and even in that favorable scenario, a technical rejection could push back the DXY to new three-year lows.
On the upside, the DXY’s first resistance comes in at 100.22, which supported the DXY back in September 2024, with a break back above the 100.00 round level as a bullish signal. A firm recovery would be a return to 101.90, which acted as a pivotal level throughout December 2023 and again as a base for the inverted head-and-shoulders (H&S) formation during the summer of 2024.
On the other hand, the 97.73 support could quickly be tested on any substantial bearish headline. Further below, a relatively thin technical support comes in at 96.94 before looking at the lower levels of this new price range. These would be at 95.25 and 94.56, meaning fresh lows not seen since 2022.
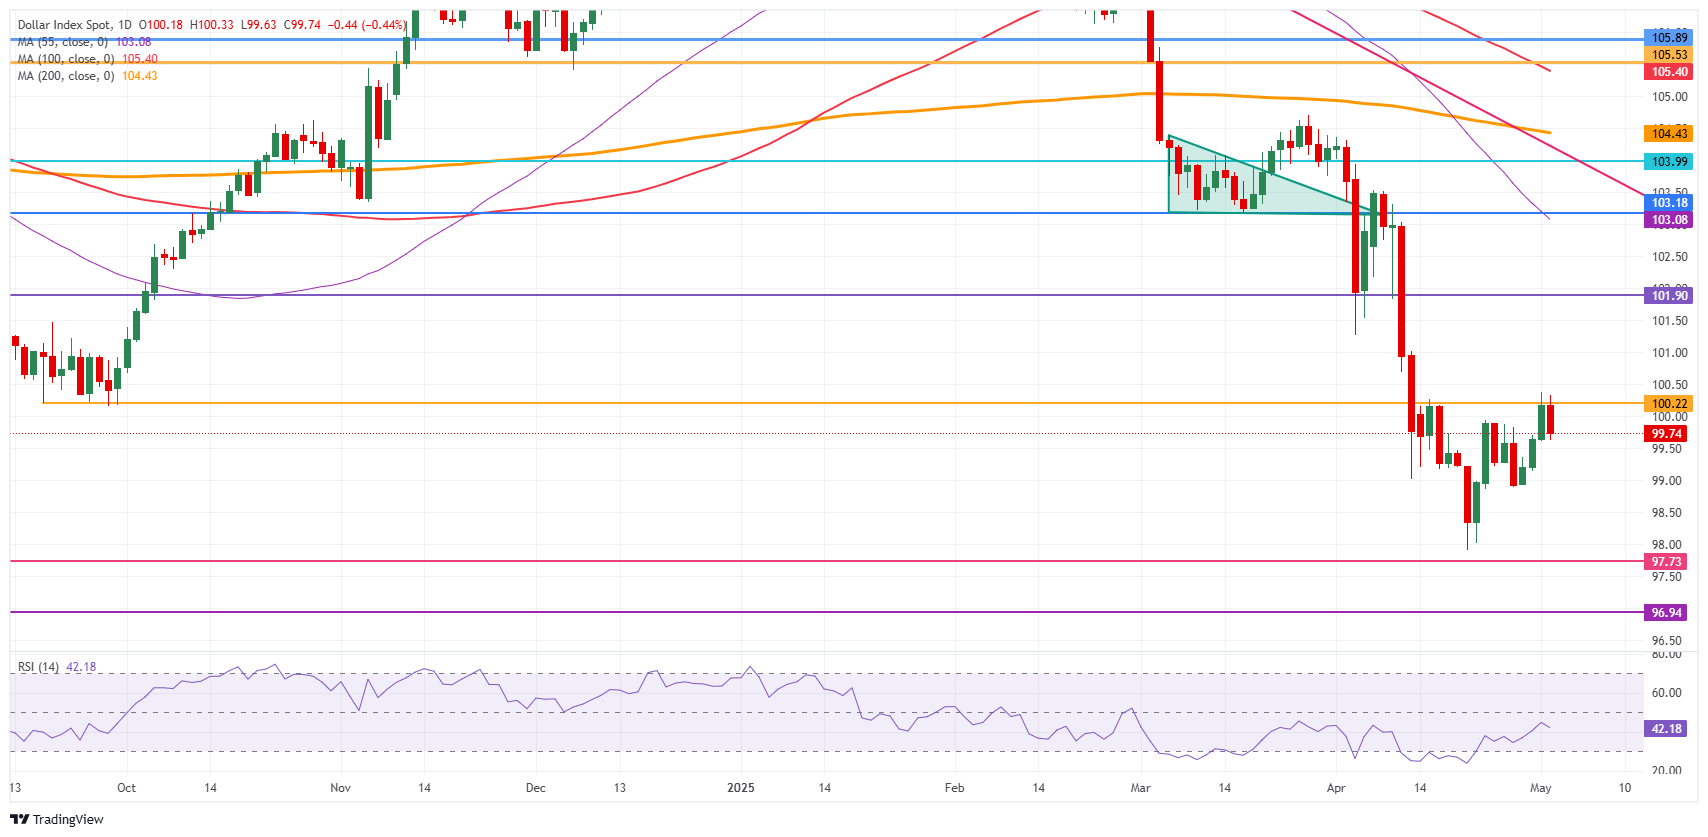
US Dollar Index: Daily Chart
US-China Trade War FAQs
Generally speaking, a trade war is an economic conflict between two or more countries due to extreme protectionism on one end. It implies the creation of trade barriers, such as tariffs, which result in counter-barriers, escalating import costs, and hence the cost of living.
An economic conflict between the United States (US) and China began early in 2018, when President Donald Trump set trade barriers on China, claiming unfair commercial practices and intellectual property theft from the Asian giant. China took retaliatory action, imposing tariffs on multiple US goods, such as automobiles and soybeans. Tensions escalated until the two countries signed the US-China Phase One trade deal in January 2020. The agreement required structural reforms and other changes to China’s economic and trade regime and pretended to restore stability and trust between the two nations. However, the Coronavirus pandemic took the focus out of the conflict. Yet, it is worth mentioning that President Joe Biden, who took office after Trump, kept tariffs in place and even added some additional levies.
The return of Donald Trump to the White House as the 47th US President has sparked a fresh wave of tensions between the two countries. During the 2024 election campaign, Trump pledged to impose 60% tariffs on China once he returned to office, which he did on January 20, 2025. With Trump back, the US-China trade war is meant to resume where it was left, with tit-for-tat policies affecting the global economic landscape amid disruptions in global supply chains, resulting in a reduction in spending, particularly investment, and directly feeding into the Consumer Price Index inflation.
Recommended Articles


