

U.S. March PCE Preview: PCE Set to Reverse Stock Market Decline

Source Tradingkey

TradingKey - The PCE is projected to fall below consensus market expectations, likely prompting the Federal Reserve to resume its rate-cutting cycle with larger-than-anticipated reductions, which would be bullish for U.S. equities.

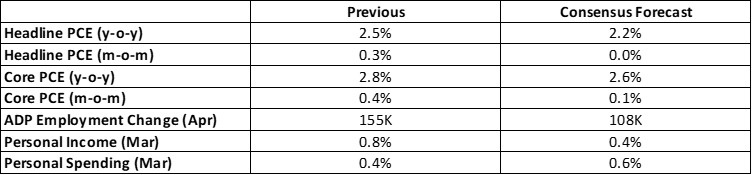
On 30 April 2025, the U.S. will release its March Personal Consumption Expenditure (PCE) data. Market consensus forecasts year-over-year headline PCE growth at 2.2% and core PCE at 2.6%, down from February’s 2.5% and 2.8%, respectively (Figure 1). However, we project March PCE will fall below these expectations for three primary reasons:

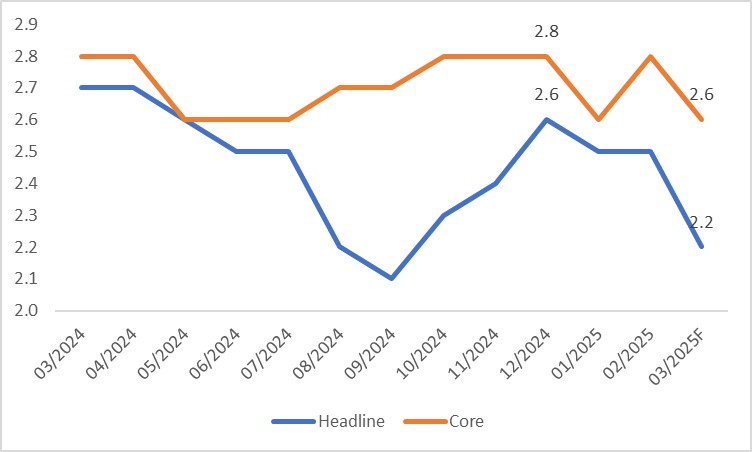
  • Persistent Downward Trend in Headline PCE: Since early 2025, headline PCE has been on a consistent decline. As a high-frequency economic indicator, PCE exhibits strong momentum, and the slide from December’s peak of 2.6% is unlikely to reverse in the near term (Figure 2).
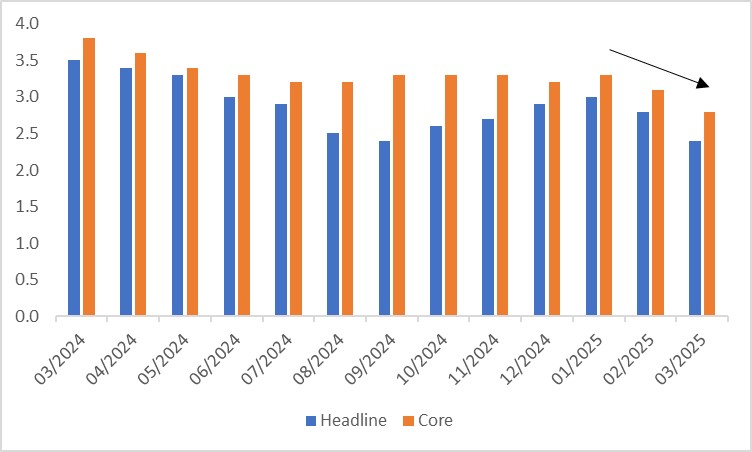
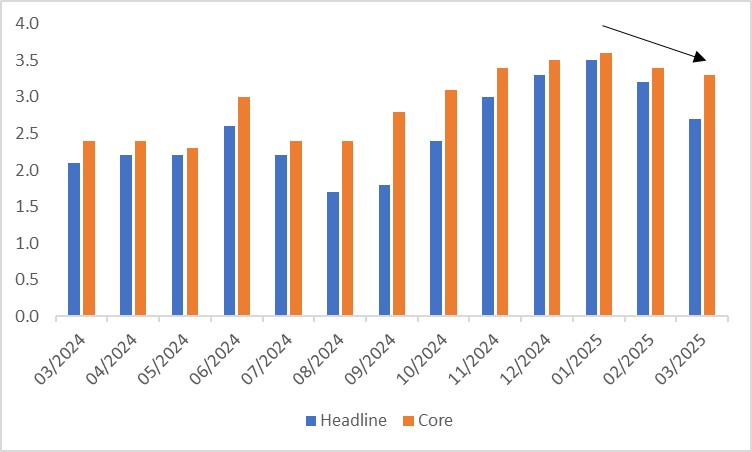
  • Correlation with Inflation Metrics: PCE, CPI, and PPI, as measures of inflation, are closely linked. Recent declines in CPI and PPI are expected to further depress March PCE (Figures 3 and 4).
  • Economic Softness: Ongoing weakness in the U.S. economy will remain a key driver of PCE’s downward trajectory.

Figure 1: Consensus Forecast
altText

Source: Refinitiv, Tradingkey.com

Figure 2: PCE (y-o-y, %)
altText

Source: Refinitiv, Tradingkey.com

Figure 3: CPI (y-o-y, %)
altText

Source: Refinitiv, Tradingkey.com

Figure 4: PPI (y-o-y, %)
altText

Source: Refinitiv, Tradingkey.com

Looking forward, tariffs are poised to become a dominant factor influencing PCE. Tariffs exert two opposing forces on inflation. Higher tariffs raise imported goods’ prices, potentially increasing inflation. Conversely, tariffs can slow economic growth, curbing inflation by reducing demand. We believe the latter effect will prevail, leading PCE to trend toward the 2% target in the short to medium term.

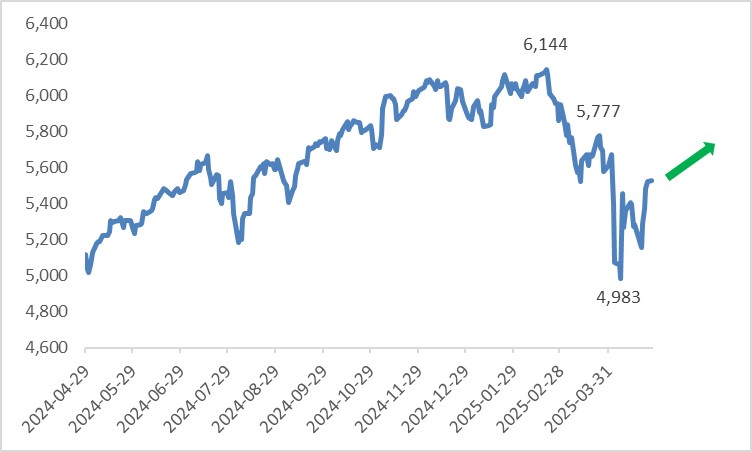
Declining inflation, coupled with a subdued economic outlook, is likely to prompt the Federal Reserve to resume its rate-cutting cycle, with reductions potentially exceeding current market expectations. This would be bullish for U.S. stocks (Figure 5) while bearish for the U.S. dollar index and Treasury yields.

Figure 5: S&P 500 Index
altText

Source: Refinitiv, Tradingkey.com

Disclaimer: For information purposes only. Past performance is not indicative of future results.
placeholder
Strong profits, falling shares: bank earnings day one meets a memory-chip rout — with CPI and ASML aheadGoldman Sachs blew past estimates (EPS $17.01 vs $13.09 expected, profit +33%) while JPMorgan missed ($5.75 vs $5.93) and Wells Fargo fell 3% — yet the S&P 500 finished flat at 7,805.45, pinned below its record close as a memory-chip rout (SOX −2.67%, Micron under $1,000) kept the pressure on. Tonight brings the week's decider: US September CPI at 8:30 ET, then Bank of America, Morgan Stanley, BlackRock and ASML before the open. Here are the levels, both cases, and the watch list.
Author  Irene Q.
Oct 14, Wed
Goldman Sachs blew past estimates (EPS $17.01 vs $13.09 expected, profit +33%) while JPMorgan missed ($5.75 vs $5.93) and Wells Fargo fell 3% — yet the S&P 500 finished flat at 7,805.45, pinned below its record close as a memory-chip rout (SOX −2.67%, Micron under $1,000) kept the pressure on. Tonight brings the week's decider: US September CPI at 8:30 ET, then Bank of America, Morgan Stanley, BlackRock and ASML before the open. Here are the levels, both cases, and the watch list.
placeholder
US September CPI recap: inflation hits 3.7% as core runs hot — is an October Fed hike back on the table?September CPI landed hot: headline 3.7% y/y, core 2.6% y/y and 0.3% m/m. October hike odds jumped from ~22% to ~37% — yet the dollar faded to 101.74, gold closed higher and the S&P 500 fell 1.11%. Here is the full repricing, the levels and what to watch next.
Author  Irene Q.
Oct 15, Thu
September CPI landed hot: headline 3.7% y/y, core 2.6% y/y and 0.3% m/m. October hike odds jumped from ~22% to ~37% — yet the dollar faded to 101.74, gold closed higher and the S&P 500 fell 1.11%. Here is the full repricing, the levels and what to watch next.
placeholder
Gold Price Analysis Today | Forex Gold Analysis | XAU/USD Analysis - October 15, 2026Get the latest gold price analysis, forex gold insights, and XAU/USD analysis for October 15, 2026. Read on for the details.
Author  Mitrade
Oct 16, Fri
Get the latest gold price analysis, forex gold insights, and XAU/USD analysis for October 15, 2026. Read on for the details.
placeholder
Gold Price Analysis Today | Forex Gold Analysis | XAU/USD Analysis - October 16, 2026Get the latest gold price analysis, forex gold insights, and XAU/USD analysis for October 16, 2026. Read on for the details.
Author  Mitrade
Oct 16, Fri
Get the latest gold price analysis, forex gold insights, and XAU/USD analysis for October 16, 2026. Read on for the details.
placeholder
Gold Price Forecast: Why Did Gold Rebound After September PPI Rose by Most in Nearly Four Years? As of the European session on October 16, gold prices (XAUUSD) extended their rebound, with the latest price trading near $4,185, up about 0.4% on the day. Gold prices had previously drop
Author  TradingKey
Oct 16, Fri
As of the European session on October 16, gold prices (XAUUSD) extended their rebound, with the latest price trading near $4,185, up about 0.4% on the day. Gold prices had previously drop
goTop
quote