US Treasury yields climb as markets adjust rate cut expectations

Source Fxstreet
  • Mixed US Treasury yields: 10-year note rises to 4.136%, short-term yields dip slightly.
  • Investor indifference to Richmond Fed data; eyes on upcoming ECB, Fed decisions impacting rate cut views.
  • Fewer expected Fed rate cuts in 2024; focus on US GDP, Jobless Claims, Core PCE index this week.

US yields advanced on Tuesday, mainly the belly and the long-end of the yield curve, while the three-month bills and the 2-year note were down one basis point, each at 5.21% and 4.383%. At the same time, the US 10-year benchmark note rate is at 4.136%, up almost three basis points, while the 20 and 30-year bond coupons witnessed a rise of four and four and a half basis points, at 4.48% and 4.37%, respectively.

Investors eye central bank’s decisions amid evolving Economic Indicators

In the US, economic data featured the Richmond Fed Composite and Manufacturing Index experienced a decline, moving from -11 to -15 in January. Conversely, the Services Index saw an improvement, rising from 0 to 4.

Although the data was mainly ignored by investors, they had priced out Federal Reserve’s March 2024 rate cut, pushing it back to ward May. Traders should be aware that the European Central Bank (ECB) will review its monetary policy decision on Thursday, ahead of next week’s Federal Reserve decision.

If the ECB remains on keeping rates higher for longer, that could sponson a leg-up in US Treasury yields. Otherwise, a subtle change of tone on major central banks' monetary policy statements could trigger volatility in the markets.

A week ago, investors anticipated the Federal Reserve to implement rate cuts totaling 175 basis points in 2024. However, as of writing, they modified their expectations to 141 basis points of monetary easing, effectively reducing their forecast by one rate cut.

Ahead of the week, the US economic docket will feature the US Gross Domestic Product (GDP) for last year’s Q4, along with Initial Jobless Claims and the Fed’s preferred gauge for inflation, the Core Personal Consumption Expenditure (PCE) price index.

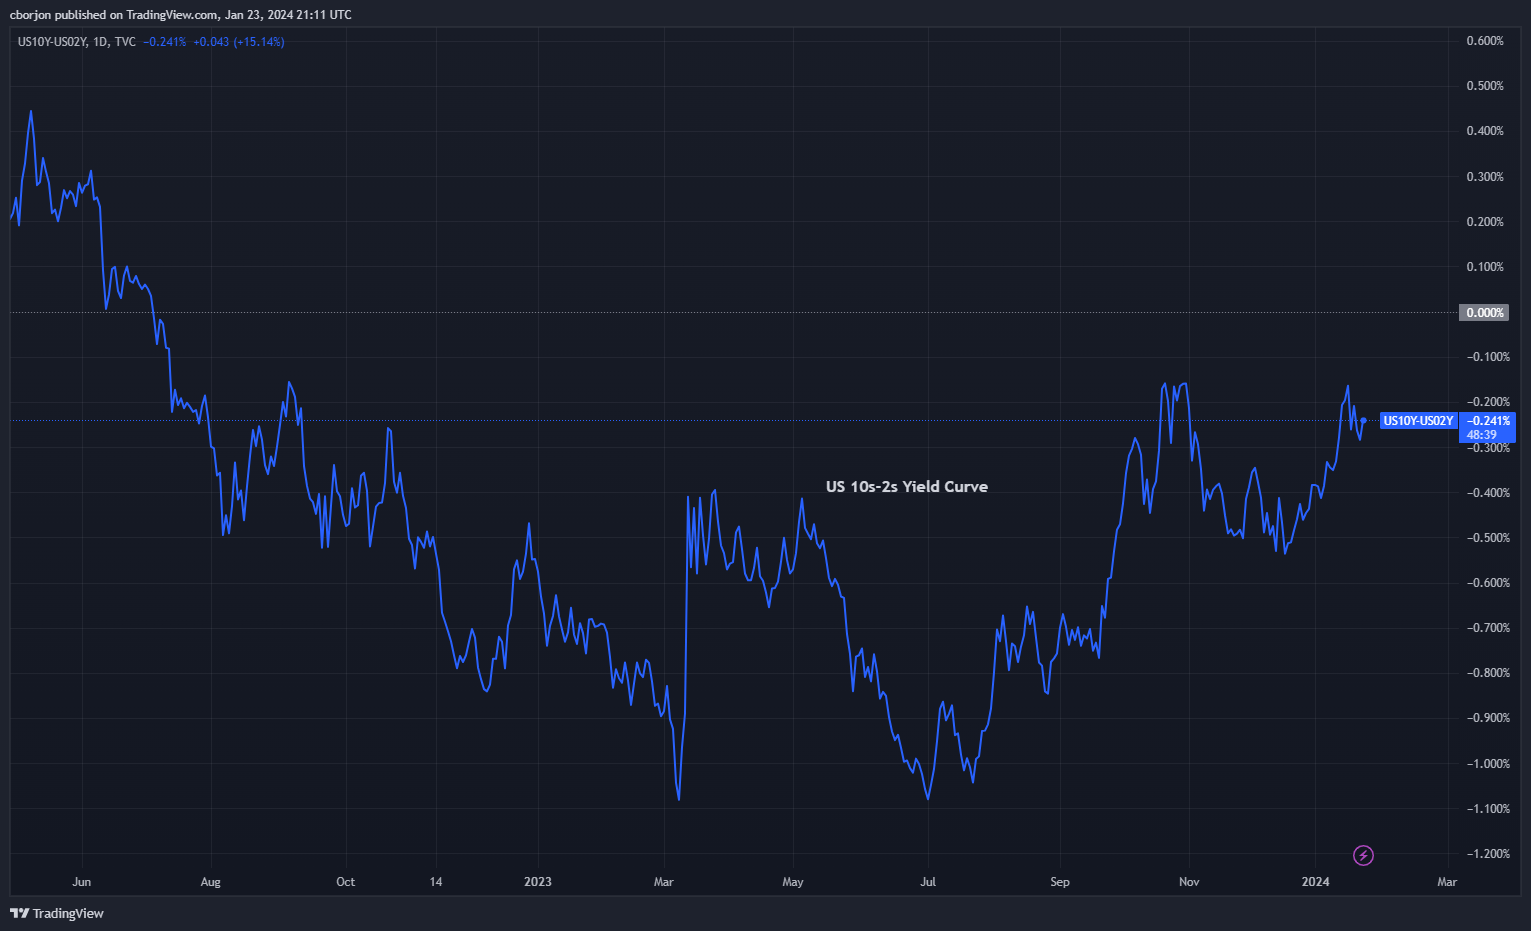
US 10s-2s Spread Chart

Disclaimer: For information purposes only. Past performance is not indicative of future results.
placeholder
Bulls Rout. Bitcoin Slumps Over 16% in a Week to Hit Bottom, Cryptocurrency Market Faces "Serial Liquidations"During the Asian trading session on June 5, Bitcoin extended its recent slump, falling more than 3.5% within 24 hours. It briefly broke below $62,000, hitting a low of $61,100, bringing i
Author  TradingKey
8 hours ago
During the Asian trading session on June 5, Bitcoin extended its recent slump, falling more than 3.5% within 24 hours. It briefly broke below $62,000, hitting a low of $61,100, bringing i
placeholder
Gold declines below $4,500 on stalled US-Iran ceasefire talks, US NFP data loomsGold price (XAU/USD) edges lower to near $4,470 during the early Asian session on Friday. The precious metal remains volatile amid ongoing geopolitical turmoil. Traders will closely monitor the developments surrounding the US-Iran peace deal and the US May employment report later on Friday. 
Author  FXStreet
17 hours ago
Gold price (XAU/USD) edges lower to near $4,470 during the early Asian session on Friday. The precious metal remains volatile amid ongoing geopolitical turmoil. Traders will closely monitor the developments surrounding the US-Iran peace deal and the US May employment report later on Friday. 
placeholder
Bitcoin Suffers Year’s Strongest Waterfall-Style Decline. Will It Next Drop to the $60,000 Mark?During the Asian trading session on June 4, Bitcoin continued its multi-day slump, briefly dropping below the $62,000 mark to $61,338. As of press time, Bitcoin was trading at $63,844, wi
Author  TradingKey
Yesterday 10: 07
During the Asian trading session on June 4, Bitcoin continued its multi-day slump, briefly dropping below the $62,000 mark to $61,338. As of press time, Bitcoin was trading at $63,844, wi
placeholder
Bitcoin drops below $65K amid reinforced bear market signalsBitcoin (BTC) dipped further below $65,000 on Wednesday, with onchain data from Glassnode signaling a market firmly in a bear phase. The decline has pushed prices back into a key valuation range between the Realized Price and the True Market Mean.
Author  FXStreet
Yesterday 01: 32
Bitcoin (BTC) dipped further below $65,000 on Wednesday, with onchain data from Glassnode signaling a market firmly in a bear phase. The decline has pushed prices back into a key valuation range between the Realized Price and the True Market Mean.
placeholder
Forex Today: US Dollar stays resilient ahead of key US dataHere is what you need to know on Wednesday, June 3:
Author  FXStreet
Jun 03, Wed
Here is what you need to know on Wednesday, June 3:
goTop
quote