

European indexes slide on Tuesday as sentiment shifts ahead of looming ECB rate expectations

Source Fxstreet
  • European stocks decline as risk rebound sees limited dip-buying.
  • ECB due Thursday, Europe PMIS on Wednesday.
  • Euro area PMIs expected to show slight growth.

European equity indexes initially climb on Tuesday, hitting near-term highs before revising direction once again and testing into the low side of recent activity.

European stocks weren’t able to follow US equities higher, lacking the same drive from AI tech stocks that saw the American equity sector climb into new highs once again on Monday.

This week sees another showing from the European Central Bank (ECB) who is expected to remain flat on interest rates for the time being despite broad-market hopes and expectations of faster, sooner rate cuts.

ECB policymakers have worked double time in the past week trying to talk down market hopes for rate cuts to begin soon, with some particularly determined investors hoping for rate cuts to start as early as March. ECB officials have pushed firmly back on overeager markets, setting a more reasonable hopeful deadline for the summer months.

European Consumer Confidence declined in January from -15.0 to -16.1 versus the forecast -14.3, and the ECB’s Bank Lending Survey kicked off the day’s overall losses after it was revealed that bank lending to both consumers and businesses have continued to decline through the third quarter, and further declines in credit facility access are expected though 2024’s first quarter.

Germany’s DAX and France’s CAC 40 both ended Tuesday down a little over a third of a percent with the DAX down 56.27 points and ending the day at €16,627.09 while the CAC 40 shed 25.21 points to close down at €7,388.04, losing 0.34% on the day.

The pan-European STOXX600 equity index shed 1.33 points to close down 0.28% at €471.53, and London’s FTSO held mostly flat on the day, closing down a scant 0.3% and down 1.98 points to £7,485.73.

DAX Technical Outlook

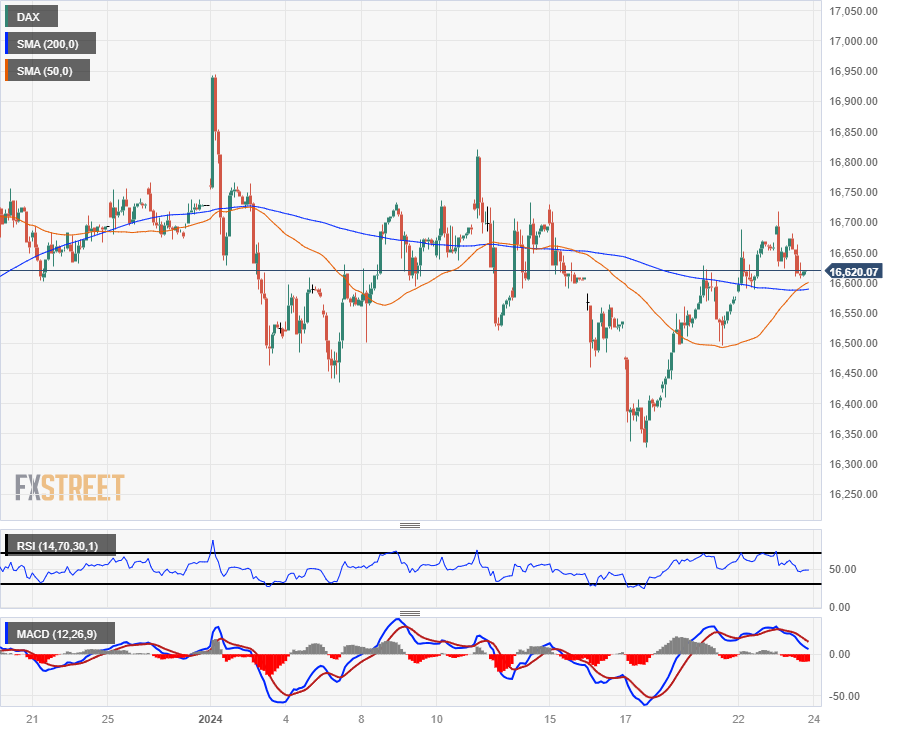
The DAX German equity index fell back after an early climb on Tuesday, touching an intraday peak above €16,700 before falling back once more. The major equity index is falling into a congestion zone between the 50-hour and 200-hour Simple Moving Average (SMA) near €16,600.00.

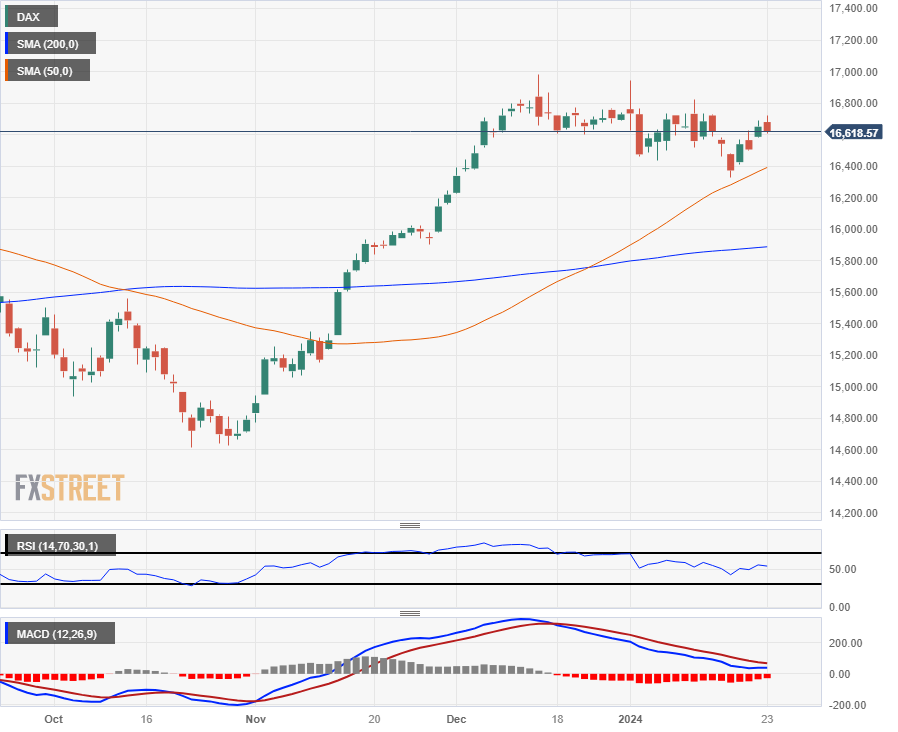
The DAX continues to mostly recover, climbing 1.7% from last week's lows near €16,328.00 but downside momentum is getting hard to ignore as the equity index sees frequent drops amidst steady moves higher.

Near-term prices see support from the 50-day SMA at €16,400.00, and a bearish extension would need to cross over the $15,800 barrier before extending into a meaningful downside trend.

DAX Hourly Chart
DAX Daily Chart
 

Disclaimer: For information purposes only. Past performance is not indicative of future results.
placeholder
US August CPI lands tonight: after a 5.4% PPI shock, will the Fed hike on September 16?US August PPI came in at 5.4% year-on-year, above the 5.3% consensus, with core PPI at 4.6%. Traders have pushed the odds of a 25bp Fed hike on September 15-16 to around 70%. Tonight's CPI is the last major inflation print before the decision — here is the full calendar, the consensus numbers, and what a hot versus cool reading would mean for the dollar, yields, gold and stocks.
Author  Irene Q.
Sep 11, Fri
US August PPI came in at 5.4% year-on-year, above the 5.3% consensus, with core PPI at 4.6%. Traders have pushed the odds of a 25bp Fed hike on September 15-16 to around 70%. Tonight's CPI is the last major inflation print before the decision — here is the full calendar, the consensus numbers, and what a hot versus cool reading would mean for the dollar, yields, gold and stocks.
placeholder
Brent tests $108 as a key export pipeline stays shut — can the rally clear $110?Brent crude rose 2.55% to $106.97 and WTI 2.32% to $102.30 as a major regional export pipeline remained offline with no restart timeline. Front-month backwardation has widened to $5.53 from $3.84 a week ago, European gas is at its highest since December 2022, and one analyst sees $119.48 if talks stall.
Author  Irene Q.
Yesterday 07: 16
Brent crude rose 2.55% to $106.97 and WTI 2.32% to $102.30 as a major regional export pipeline remained offline with no restart timeline. Front-month backwardation has widened to $5.53 from $3.84 a week ago, European gas is at its highest since December 2022, and one analyst sees $119.48 if talks stall.
placeholder
Fed hike odds near 90% into Wednesday's decision — how to trade the dollar, gold and the S&P 500A 0.3% monthly core CPI print has lifted the market-implied probability of a 25bp Fed hike on 16 September to roughly 86.5% ~ 90%, which would be the first increase since July 2023. Here is the decision timeline, the pricing versus the forecasts, both scenarios, and the key levels for the dollar, gold and the S&P 500.
Author  Suzie
Yesterday 07: 49
A 0.3% monthly core CPI print has lifted the market-implied probability of a 25bp Fed hike on 16 September to roughly 86.5% ~ 90%, which would be the first increase since July 2023. Here is the decision timeline, the pricing versus the forecasts, both scenarios, and the key levels for the dollar, gold and the S&P 500.
placeholder
Silver Price Forecast: XAG/USD falls to near $63.50 amid Fed hike bets, higher oil pricesSilver price (XAG/USD) loses its gains from the previous day, trading around $63.50 per troy ounce during Asian hours on Monday. Non-yielding Silver is currently facing significant headwinds driven by rising Federal Reserve (Fed) rate-hike expectations for the upcoming September decision.
Author  FXStreet
Yesterday 10: 37
Silver price (XAG/USD) loses its gains from the previous day, trading around $63.50 per troy ounce during Asian hours on Monday. Non-yielding Silver is currently facing significant headwinds driven by rising Federal Reserve (Fed) rate-hike expectations for the upcoming September decision.
placeholder
【Daily Brief】10-year Treasury yield briefly tops 5%, S&P 500 slips to 7,602 and the dollar firms at 99.3 as the Fed's decision eve beginsThe 10-year Treasury yield touched 5.014% on Monday — its first print above 5% since October 2023 — while the S&P 500 closed 0.48% lower at 7,619.98 and the dollar index firmed to 99.3. Here is the full market wrap ahead of Wednesday's FOMC decision, the dot plot and the August retail sales report, plus today's CLARITY Act Senate vote.
Author  Irene Q.
4 hours ago
The 10-year Treasury yield touched 5.014% on Monday — its first print above 5% since October 2023 — while the S&P 500 closed 0.48% lower at 7,619.98 and the dollar index firmed to 99.3. Here is the full market wrap ahead of Wednesday's FOMC decision, the dot plot and the August retail sales report, plus today's CLARITY Act Senate vote.
goTop
quote