

S&P 500 closes at all-time high in Friday risk rally led by tech sector rip

Source Fxstreet
  • US indexes climbed on Friday, led by chip makers.
  • Investors have pivoted to tech shares to shake off Fed rate tantrum.
  • Markets go haywire as the US Dollar, US equities, and Treasury yields all rise.

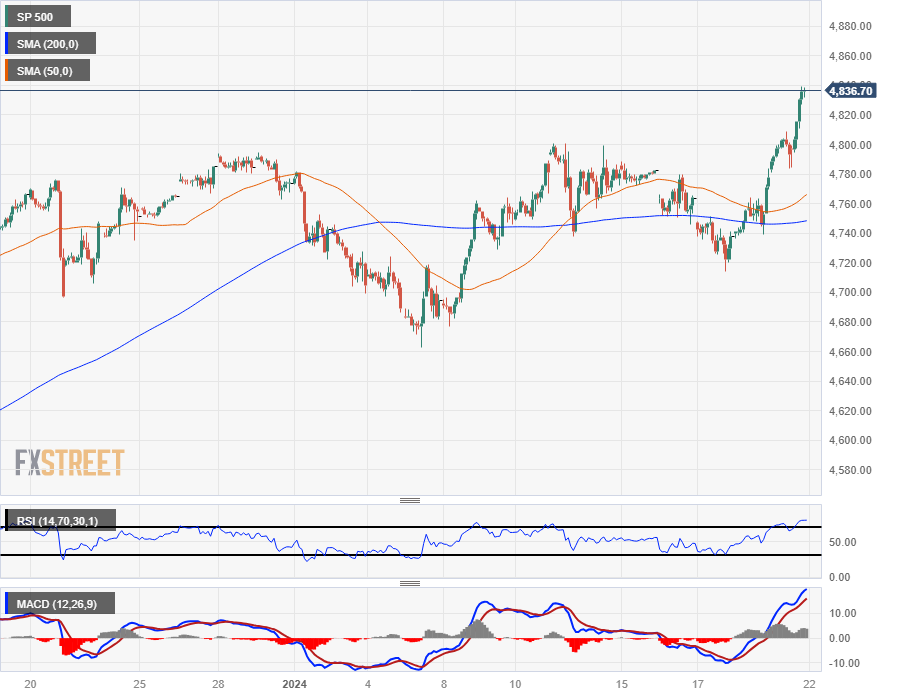
The Standard & Poor’s drove to a new all-time high of $4,839.58 on Friday as equities broadly rallied as investors pile into future earnings bets on large-cap tech stocks, with chip-makers loosely associated with AI tech projects leading the charge.

Money markets are broadly shaking off months of begrudgingly giving up ground on rate cut expectations from the Federal Reserve (Fed). According to the CME’s FedWatch tool, rate swap bets are pricing in nearly a 40% chance of a rate cut at the Fed’s March policy meeting, down significantly from over a 70% chance just a month ago.

Fed officials have been pushing back against market expectations of an increased pace of rate cuts from the US central bank, and markets appear to finally be listening as US economic data continues to thump market forecasts, printing consistently higher and healthier than investors were hoping for as markets yearn for cheaper lending and borrowing costs.

US Consumer Sentiment improved to its best reading since July of 2021 according to the University of Michigan’s consumer sentiment survey. The UoM’s 5-year Consumer Inflation Expectations Survey in January also declined to familiar lows at 2.8% from December’s 2.9%.

With the US economy continuing to bump along at a healthy clip and US consumers expecting inflation to remain above the Fed’s 2% target for the foreseeable future, market hopes of Fed rate cuts are unlikely to see a happy conclusion, with money markets now leaning into the FOMC’s May meeting as a possible start to the next cutting cycle.

The Dow Jones Industrial Average (DJIA) also rose to an all-time high, touching $37,931.36 and wrapping up Friday at $37,863.80, climbing over 395 points and gaining 1.05% on the day.

The NASDAQ Composite and NASDAQ 100 indexes hit their own all-time highs on Friday, with the NASDSAQ Composite climbing 255.32 to $15,310.97 to a Friday gain of 1.7% while the NASDAQ 100 soared 1.75% to end at $17,316.87, up over 296 points.

S&P 500 Technical Outlook

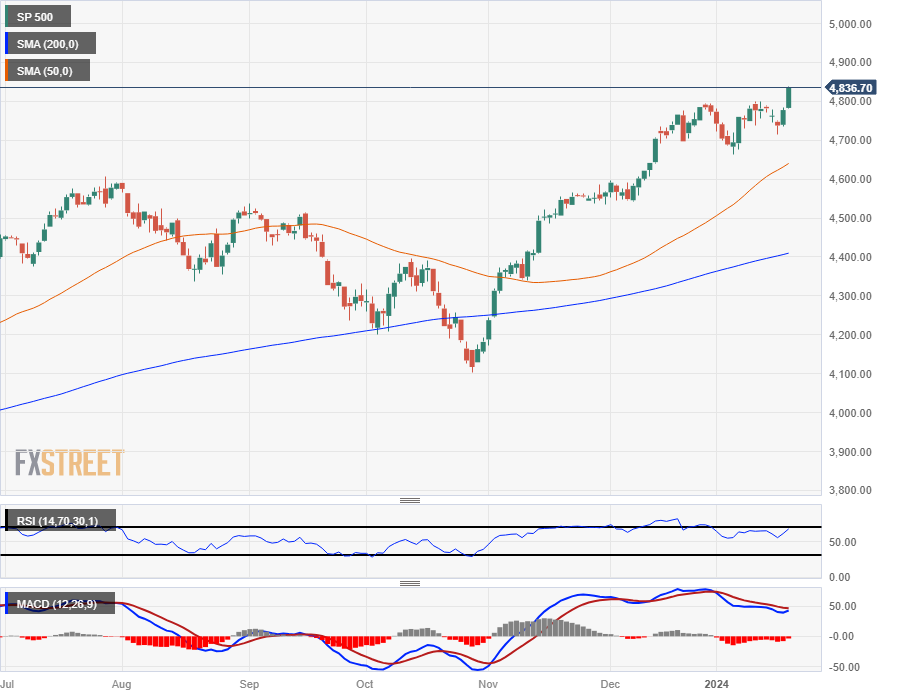
The S&P 500 major equity index climbed nearly one and a quarter percent to hit an all-time high of its own, ending Friday at $4,839.81, up 58.87 points on the day.

Near-term bullish momentum in equity indexes has sent the S&P well above any technical zones and pinning into record peaks. The S&P could decline over 8% and still be in bull country above the 200-day Simple Moving Average (SMA) near $4,400.00, and the closest technical barrier sits at the 50-day SMA near $4,650.00.

S&P 500 Hourly Chart
S&P 500 Daily Chart
 

Disclaimer: For information purposes only. Past performance is not indicative of future results.
placeholder
Gold Price Forecast: PPI and Oil Prices Fuel Inflation Concerns, Can CPI Change Gold's Direction?As of the Asian session on September 11, gold prices (XAUUSD) remained in weak consolidation today after dropping sharply to near $4,300 on Thursday, with the latest price trading around
Author  TradingKey
12 hours ago
As of the Asian session on September 11, gold prices (XAUUSD) remained in weak consolidation today after dropping sharply to near $4,300 on Thursday, with the latest price trading around
placeholder
US August CPI lands tonight: after a 5.4% PPI shock, will the Fed hike on September 16?US August PPI came in at 5.4% year-on-year, above the 5.3% consensus, with core PPI at 4.6%. Traders have pushed the odds of a 25bp Fed hike on September 15-16 to around 70%. Tonight's CPI is the last major inflation print before the decision — here is the full calendar, the consensus numbers, and what a hot versus cool reading would mean for the dollar, yields, gold and stocks.
Author  Irene Q.
15 hours ago
US August PPI came in at 5.4% year-on-year, above the 5.3% consensus, with core PPI at 4.6%. Traders have pushed the odds of a 25bp Fed hike on September 15-16 to around 70%. Tonight's CPI is the last major inflation print before the decision — here is the full calendar, the consensus numbers, and what a hot versus cool reading would mean for the dollar, yields, gold and stocks.
placeholder
US-Iran Conflict Drives Oil Surge as WTI Tops $100 and Brent Nears $110International oil prices continued to advance rapidly this week. On Thursday Eastern Time, WTI crude (USOIL) broke through the $100/barrel mark, closing at $103.94, up 7.51%; Brent crude
Author  TradingKey
20 hours ago
International oil prices continued to advance rapidly this week. On Thursday Eastern Time, WTI crude (USOIL) broke through the $100/barrel mark, closing at $103.94, up 7.51%; Brent crude
placeholder
TradingKey Daily Market Briefing: WTI Oil Tops $100, US Stocks Fall for 4th Day, Apple Bucks Trend, CPI AheadTracking Market TrendsTradingKey - On September 10 Eastern Time, the three major US stock indices fell for the fourth consecutive trading day. US August PPI showed upstream price pressures continued t
Author  TradingKey
21 hours ago
Tracking Market TrendsTradingKey - On September 10 Eastern Time, the three major US stock indices fell for the fourth consecutive trading day. US August PPI showed upstream price pressures continued t
placeholder
US August CPI Preview: Will Inflation Reaccelerate? US Stocks, Dollar and Gold Face Key Test On Friday, September 11 (ET), the U.S. Bureau of Labor Statistics will release the Consumer Price Index (CPI) for August, the final major inflation report before the Federal Reserve's Sep
Author  TradingKey
Yesterday 10: 10
On Friday, September 11 (ET), the U.S. Bureau of Labor Statistics will release the Consumer Price Index (CPI) for August, the final major inflation report before the Federal Reserve's Sep
Related Instrument
goTop
quote