AUD/NZD declines following higher inflation figures from Australia and soft ANZ data

Source Fxstreet
  • The AUD/NZD declines to a low of 1.0815 after reaching a high of 1.0850 on Wednesday.
  • Australian high-tier data tempers RBA's dovish expectations, while soft New Zealand data renews RBNZ policy divergence.
  • Following downbeat ANZ data, the market bets over higher odds of an RBNZ rate cut in November.

The AUD/NZD was seen trading lower during Wednesday's trading session, as markets digest high-tier data from both Australia and New Zealand.

In Australia, April's Consumer Price Indxe (CPI) came in hot at 3.6% YoY, surpassing the 3.4% expectations and the previous month's 3.5%. This marked the second consecutive month of acceleration and is the highest inflation rate since November. With core inflation remaining sticky above 4%, there are strong signals that the Reserve Bank of Australia (RBA) might turn its tone to a more hawkish one.

Meanwhile, the disappointing ANZ business survey data for May became a focal point in New Zealand. The Own Activity Outlook index dropped to a low of 11.8 from 14.3 in April, hinting towards weaker growth. Recently sticky domestic inflation led to the RBNZ discussing a potential rate increase which led to a significant strengthening of the Kiwi, markets are betting that the first cut will come in November of this year, priced in by 65%.

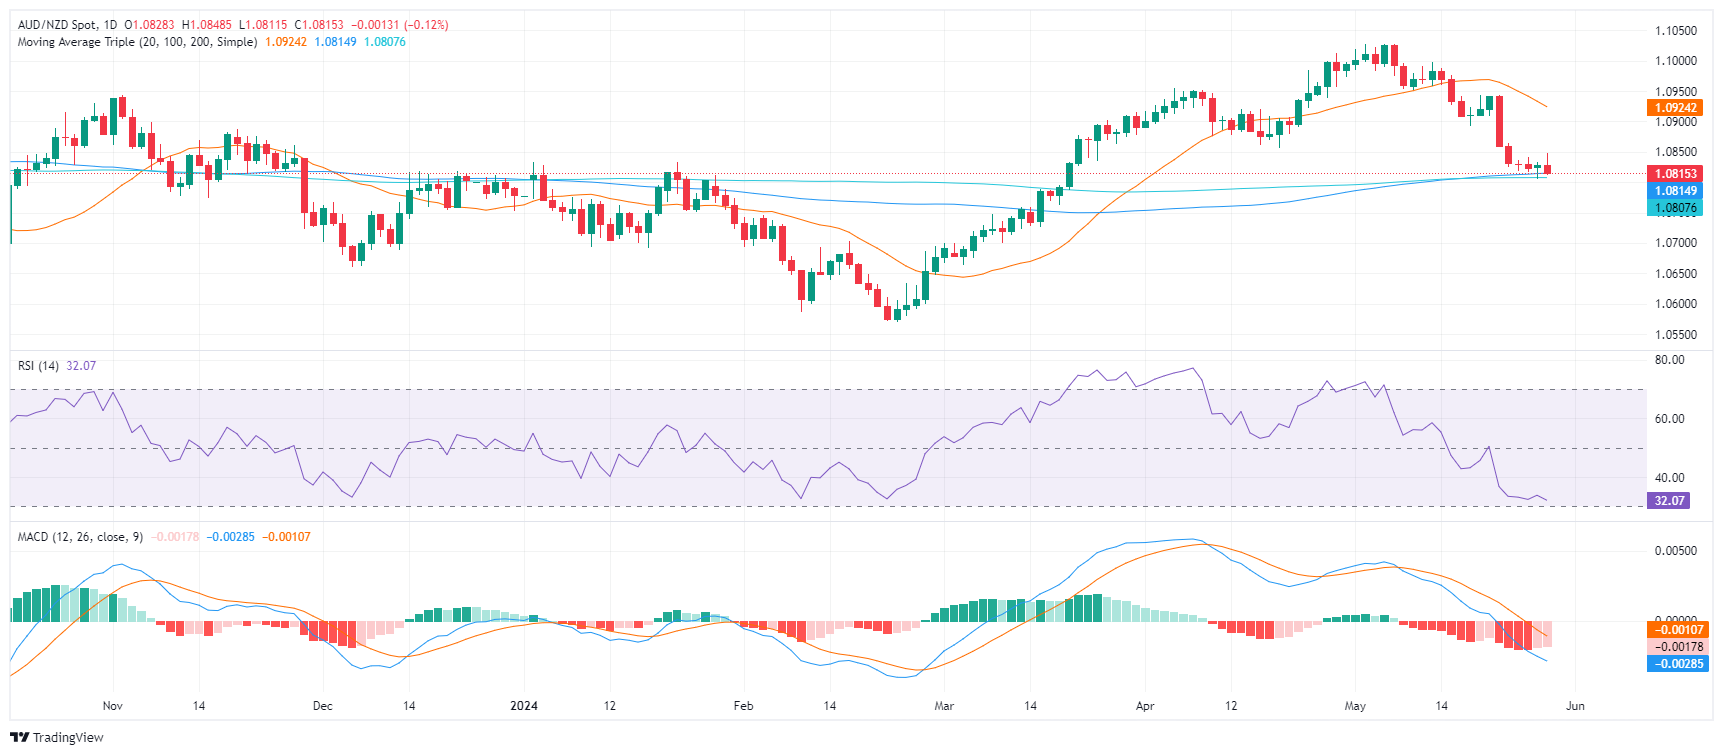
AUD/NZD technical analysis

On the daily chart, the Relative Strength Index (RSI) remains in negative territory, indicating a robust downtrend. This is consolidated by the rising red bars of the Moving Average Convergence Divergence (MACD) histogram, which confirms the continued downward momentum.

That being said, as the pair approached oversold terrain, the pair may see a slight upward correction in the next sessions.

AUD/NZD daily chart

AUD/NZD

Overview
Today last price 1.0816
Today Daily Change -0.0012
Today Daily Change % -0.11
Today daily open 1.0828
 
Trends
Daily SMA20 1.0934
Daily SMA50 1.0921
Daily SMA100 1.0814
Daily SMA200 1.0808
 
Levels
Previous Daily High 1.0833
Previous Daily Low 1.0806
Previous Weekly High 1.0944
Previous Weekly Low 1.0819
Previous Monthly High 1.1012
Previous Monthly Low 1.0857
Daily Fibonacci 38.2% 1.0822
Daily Fibonacci 61.8% 1.0816
Daily Pivot Point S1 1.0812
Daily Pivot Point S2 1.0795
Daily Pivot Point S3 1.0785
Daily Pivot Point R1 1.0839
Daily Pivot Point R2 1.0849
Daily Pivot Point R3 1.0866


Disclaimer: For information purposes only. Past performance is not indicative of future results.
placeholder
ECB Policy Outlook for 2026: What It Could Mean for the Euro’s Next MoveWith the ECB likely holding rates steady at 2.15% and the Fed potentially extending cuts into 2026, EUR/USD may test 1.20 if Eurozone growth proves resilient, but weaker growth and an ECB pivot could pull the pair back toward 1.13 and potentially 1.10.
Author  Mitrade
10 hours ago
With the ECB likely holding rates steady at 2.15% and the Fed potentially extending cuts into 2026, EUR/USD may test 1.20 if Eurozone growth proves resilient, but weaker growth and an ECB pivot could pull the pair back toward 1.13 and potentially 1.10.
placeholder
Dogecoin Is Repeating Its 2020 Accumulation Cycle, Analyst SaysCrypto analyst Cryptollica (@Cryptollica on X) is arguing that Dogecoin’s weekly chart is doing that familiar thing again: carving out a rounded base, bleeding off volatility, resetting momentum
Author  NewsBTC
10 hours ago
Crypto analyst Cryptollica (@Cryptollica on X) is arguing that Dogecoin’s weekly chart is doing that familiar thing again: carving out a rounded base, bleeding off volatility, resetting momentum
placeholder
TradingKey 2025 Markets Recap & Outlook | Gold Records Its Best Performance in Half a Century, Wall Street Predicts $5,000 Breach in 2026TradingKey - Amid increasing global economic uncertainty, gold is experiencing its best year since 1979, recording its largest gain in 46 years.As of December 26, the price of gold futures (New York g
Author  TradingKey
10 hours ago
TradingKey - Amid increasing global economic uncertainty, gold is experiencing its best year since 1979, recording its largest gain in 46 years.As of December 26, the price of gold futures (New York g
placeholder
Top 10 crypto predictions for 2026: Institutional demand and big banks could lift BitcoinCrypto’s 2026 outlook hinges on whether institutional demand returns—via ETFs, banks and digital-asset treasury buyers—with BTC facing a wide range between support near $80,600 and a potential $140,259 upside target, while stablecoins, AI tokens, Solana growth and regulation remain key themes.
Author  Mitrade
10 hours ago
Crypto’s 2026 outlook hinges on whether institutional demand returns—via ETFs, banks and digital-asset treasury buyers—with BTC facing a wide range between support near $80,600 and a potential $140,259 upside target, while stablecoins, AI tokens, Solana growth and regulation remain key themes.
placeholder
TradingKey 2025 Markets Recap & Outlook | Global Central Banks 2025 Recap and 2026 Outlook: Navigating Post-Easing Recovery and Diverging PathsIn 2025, major central banks globally generally maintained an accommodative stance, but the pace of policy adjustment slowed significantly. As inflation gradually came under control and e
Author  TradingKey
Yesterday 10: 31
In 2025, major central banks globally generally maintained an accommodative stance, but the pace of policy adjustment slowed significantly. As inflation gradually came under control and e
goTop
quote