US equity indexes close broadly higher on Wednesday ahead of Thursday’s US CPI print

Source Fxstreet
  • US stocks printed in the green on Wednesday, led by megacap and tech gains.
  • Nvidia hits a record high, while Meta and Alphabet post 12-month gains.
  • Investors are leaning bullish in the run-up to Thursday’s US CPI inflation reading.

The overwhelming majority of US equity indexes closed in the green on Wednesday, fueled in large part by record-setting highs in chipmaker Nvidia, while Facebook owner Meta and Google operator Alphabet both posted 12-month highs through the day. Tech and megacap gains led broader indexes deeper into the green, and investors will be pivoting towards Thursday’s upcoming US Consumer Price Index (CPI) inflation print.

Equities have clawed back most of the losses seen at the outset of 2024 following a stellar ramp-up in market bets that the Federal Reserve (Fed) would get pushed into a faster and deeper pace of rate cuts in 2024, with money markets pricing in upwards of a 90% chance of rate cuts coming as soon as March.

The first US Nonfarm Payrolls of 2024 splashed cold water on market expectations as a still-firm labor market in the US keeps odds of impending rate cuts much lower than the market buildup was hoping for, sending market bets of a first cut in March back down to a reasonable but still hopeful 60%.

US CPI Preview: Forecasts from 10 major banks

Despite broad-market hopes, market forecasts see the headline US CPI inflation print for December to come in at 0.2% MoM compared to November’s print of 0.1%. Annualized US CPI inflation through December is likewise expected to tick slightly higher from 3.1% to 3.2%, while Core MoM CPI is expected to hold steady at 0.3%.

With investors hoping for signs of easing long-term inflation to kickstart the next rate cut cycle, markets will be focusing on annualized Core CPI through December, which is forecast to slightly decline from 4.0% to 3.8%.

The Dow Jones Industrial Average climbed 170.57 points to close up 0.45% at $37,695.73, while the NASDAQ Composite gained 111.94 points, ending Wednesday at $14,969.65 and climbing 0.75% on the day. The S&P 500 also added just under 27 points to close up 0.57% at $4,783.45.

S&P 500 Technical Outlook

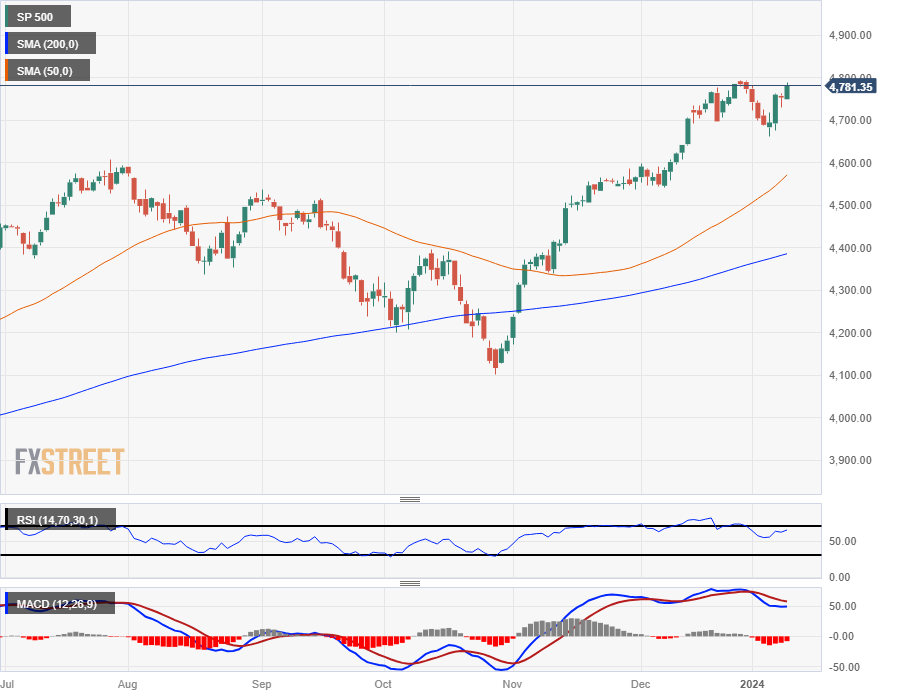
The Standard & Poor’s 500 (S&P) major equity index is back within touch range of late December’s 22-month high of $4,794.65, and is one good push away from setting new all-time highs beyond 2021’s peak bids of $4,812.38.

The S&P has muscled its way back over the 200-hour Simple Moving Average (SMA) just above $4,740.00, set for a challenge of the $4,800.00 handle with the index clawing back almost all of 2024’s early declines. The S&P bottomed out near $4,680.00 after a 2.75% decline from late December’s peak, and has rallied into the top end once more.

S&P 500 Hourly Chart

S&P 500 Daily Chart

S&P 500 Technical Levels


Disclaimer: For information purposes only. Past performance is not indicative of future results.
placeholder
ECB Policy Outlook for 2026: What It Could Mean for the Euro’s Next MoveWith the ECB likely holding rates steady at 2.15% and the Fed potentially extending cuts into 2026, EUR/USD may test 1.20 if Eurozone growth proves resilient, but weaker growth and an ECB pivot could pull the pair back toward 1.13 and potentially 1.10.
Author  Mitrade
Dec 26, 2025
With the ECB likely holding rates steady at 2.15% and the Fed potentially extending cuts into 2026, EUR/USD may test 1.20 if Eurozone growth proves resilient, but weaker growth and an ECB pivot could pull the pair back toward 1.13 and potentially 1.10.
placeholder
My Top 5 Stock Market Predictions for 2026Five 2026 market predictions written in a native, news-style voice: AI’s winners and losers, broader sector leadership, dividend demand, valuation cooling as the Shiller CAPE sits at 39 (Dec. 31, 2025), and quantum-computing bursts—while keeping all original facts and numbers unchanged.
Author  Mitrade
Jan 06, Tue
Five 2026 market predictions written in a native, news-style voice: AI’s winners and losers, broader sector leadership, dividend demand, valuation cooling as the Shiller CAPE sits at 39 (Dec. 31, 2025), and quantum-computing bursts—while keeping all original facts and numbers unchanged.
placeholder
Japanese Yen extends the range play against USD; looks to BoJ for fresh impetusThe USD/JPY pair is seen consolidating in a narrow band around mid-159.00s during the Asian session on Tuesday as traders opt to wait for the crucial Bank of Japan (BoJ) before placing fresh directional bets.
Author  FXStreet
Apr 28, Tue
The USD/JPY pair is seen consolidating in a narrow band around mid-159.00s during the Asian session on Tuesday as traders opt to wait for the crucial Bank of Japan (BoJ) before placing fresh directional bets.
placeholder
Gold holds steady near $4,600 as Fed rate decision loomsGold price (XAU/USD) holds steady near $4,600 during the early Asian session on Wednesday. The precious metal steadies as traders await a key Federal Reserve (Fed) interest rate decision later on Wednesday. 
Author  FXStreet
Yesterday 01: 15
Gold price (XAU/USD) holds steady near $4,600 during the early Asian session on Wednesday. The precious metal steadies as traders await a key Federal Reserve (Fed) interest rate decision later on Wednesday. 
placeholder
Goldman Sachs: Structurally Bullish on Gold to $5,400, But Warns of Short-Term PullbackGoldman Sachs ( GS) 's latest precious metals research report on gold ( XAUUSD) price trends presents a "structurally bullish, tactically cautious" dual outlook, maintaining its year-end
Author  TradingKey
Yesterday 10: 13
Goldman Sachs ( GS) 's latest precious metals research report on gold ( XAUUSD) price trends presents a "structurally bullish, tactically cautious" dual outlook, maintaining its year-end
Related Instrument
goTop
quote