USD/THB sees red on quiet Monday, eyes on May's FOMC minutes

Source Fxstreet
  • USD/THB trades at around 36.11, marking a 0.15% decrease in Monday's session.
  • Fed officials ask for caution on premature easing, despite some recent data weakness.
  • May’s FOMC minutes, April’s S&P PMIs, and Durable Goods figures from May will be the highlights this week.

The USD/THB pair is trading mildly down on Monday after falling to a low of 36.05 earlier in the session and managed to clear most of the daily losses. The USD is holding its ground, driven by cautious comments from the Federal Reserve (Fed) officials who are reluctant to loosen monetary policy prematurely.

Fed policymakers reiterated their reluctance towards premature easing on Monday, referencing that it is too soon to consider as evidence of disinflation the recent soft inflation data. The odds of a cut by the Fed until September is bookmarked at around 35% but officials and mid-tier data this week may change those odds.

Investors seem to be waiting for additional delivery of Fed speeches this week and for May's Federal Open Market Committee (FOMC) minutes slated for release this Wednesday, hoping for greater clarity on the direction of the Fed’s outlook. On Thursday, May’s S&P readings and weekly Jobless Claims will be looked upon as well as Friday’s Durable Goods figures from April.

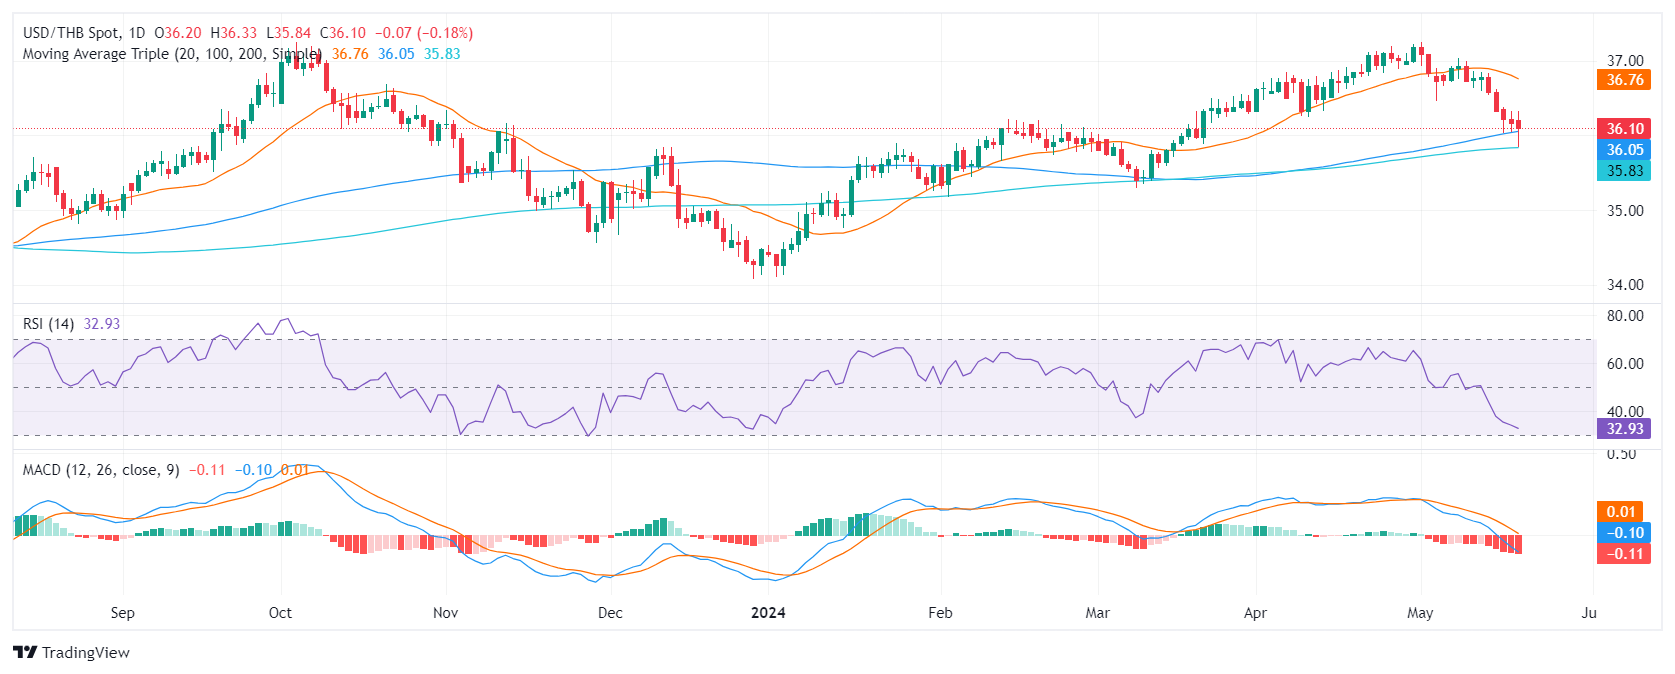
USD/THB technical analysis

Examining the daily graph, the Relative Strength Index (RSI) of the USD/THB is hovering in the negative territory, suggesting a hint of bearish momentum. Simultaneously, the Moving Average Convergence Divergence (MACD) histogram is displaying red bars, indicating a negative momentum. Yet, as the histogram bars are flat, these suggest a decreasing selling pressure and the potential for a lessening in the current bearish bias.

USD/THB daily chart

Regarding the Simple Moving Average (SMA), the pair is below the 20, 100-day SMAs. However, it is noteworthy that in Monday's session, buyers defended the 200-day SMA at the 35.83 mark. This reveals resilience, potentially impeding the bearish narrative and may trigger a bullish sentiment if sustained. This combination reveals that the pair is in a bearish trend but if the bulls remain resilient, the losses might be limited.


Disclaimer: For information purposes only. Past performance is not indicative of future results.
placeholder
The 2026 Fed Consensus Debate: Not Hassett, It’s About Whether Powell Stays or GoesKevin Hassett, White House National Economic Council Director, is poised to succeed Jerome Powell as the next Federal Reserve Chair. This development signals a potentially more dovish mon
Author  TradingKey
7 hours ago
Kevin Hassett, White House National Economic Council Director, is poised to succeed Jerome Powell as the next Federal Reserve Chair. This development signals a potentially more dovish mon
placeholder
Avalanche Bulls Eye Trend Reversal, Though Muted Derivatives Signal CautionAvalanche (AVAX) consolidates above $14.00 after an 8% breakout, but with open interest below $600 million and key resistance at $17.14 looming, traders remain cautious.
Author  Mitrade
9 hours ago
Avalanche (AVAX) consolidates above $14.00 after an 8% breakout, but with open interest below $600 million and key resistance at $17.14 looming, traders remain cautious.
placeholder
Bitcoin Bollinger Bands indicate another 'parabolic' bull signal like late 2023Historical patterns indicate that low BandWidth levels often precede significant BTC price increases.
Author  Mitrade
10 hours ago
Historical patterns indicate that low BandWidth levels often precede significant BTC price increases.
placeholder
AUD/USD sticks to gains above 0.6600, highest since late October after Aussie trade dataThe AUD/USD pair prolongs its strong uptrend witnessed over the past two weeks or so and advances to a fresh high since late October during the Asian session on Thursday.
Author  FXStreet
15 hours ago
The AUD/USD pair prolongs its strong uptrend witnessed over the past two weeks or so and advances to a fresh high since late October during the Asian session on Thursday.
placeholder
Solana Price Forecast: ETF Demand and Derivatives Flows Fuel a Sharper ReboundSolana (SOL) trades above $140 after a 10% daily jump, as ETF inflows flip positive, futures open interest climbs 6.75% and on-chain TVL and stablecoin liquidity rise, setting up a potential double-bottom breakout toward the 50-day EMA at $158 if SOL can secure a daily close above $145.
Author  Mitrade
Yesterday 06: 36
Solana (SOL) trades above $140 after a 10% daily jump, as ETF inflows flip positive, futures open interest climbs 6.75% and on-chain TVL and stablecoin liquidity rise, setting up a potential double-bottom breakout toward the 50-day EMA at $158 if SOL can secure a daily close above $145.
goTop
quote