

Analysis and Outlook of the U.S. Macroeconomy in 2026
Executive Summary
TradingKey - The U.S. economic growth is expected to maintain strong resilience in 2026, driven by four key factors. First, from a medium-term perspective, the U.S. economy staged a robust rebound starting from the second quarter of 2025, with the quarter-on-quarter annualized growth rate of real GDP climbing to 4.3% in the third quarter, significantly outpacing the market expectation of 3.3%. As core indicators for gauging the economy’s underlying momentum, the substantial rebound in the growth rates of private consumption and investment underscores the solid foundation underpinning the resilience of U.S. domestic demand. Second, the U.S. government shutdown in the fourth quarter of 2025 lasted longer than market expectations, a development that likely restrained GDP growth in that quarter. The resulting low-base effect will lift the U.S. economic growth figures in 2026, with the GDP growth rates in the first and second quarters of the year set to receive a more pronounced boost. Third, driven by the "One Big Beautiful Bill" Act, the U.S. fiscal easing in the first half of 2026 is projected to be significantly more aggressive than that in the second half of 2025. This policy effect will be transmitted to the economy primarily through two channels: tax rebates and tax cuts for household sector. Fourth, capital expenditure in the AI sector is expected to surpass the current market consensus forecast in 2026, and "AI+" related investments, including those in power infrastructure, also stand a chance of outperforming expectations. According to a recent research report released by the Federal Reserve, the contribution of AI capital expenditure to GDP growth is likely to rise to 0.4 percentage points in 2026, higher than the 2025 level. Based on the above four factors, our calculations indicate that the full-year real GDP growth rate of the U.S. may reach around 2.5% in 2026, a figure that is notably higher than the current market consensus of 2.1%.
On the inflation and monetary policy front, driven by a combination of factors—including the less-than-previously-expected pass-through effect of tariffs on inflation, a broad downtrend in international oil prices, and persistently muted wage growth—the probability of a sharp inflation rebound in 2026 remains low, even though the current headline and core CPI in the U.S. are still well above the 2% policy target. Both inflation metrics are projected to stabilize within the range of 2.6% to 2.8% throughout this year. The resilience of economic growth has reduced the urgency for the Federal Reserve to implement a prolonged interest rate cut cycle; meanwhile, the moderate and manageable inflation level has ruled out the possibility of the Fed restarting a rate-hiking cycle. Against this backdrop, the current market consensus suggests that the Federal Reserve may initiate one rate cut each in June and October 2026 respectively. In the U.S. stock market, multiple positive catalysts are converging: supported by the robust resilience of U.S. economic growth, the clear tailwinds from the Fed’s rate cut cycle, and the fundamental strengths of steady industrialization progress in the AI sector without forming a significant valuation bubble—coupled with the global capital reallocation dividend brought by the U.S. dollar index lingering in a downward trajectory. Under such circumstances, the U.S. stock market is expected to retain upside potential in 2026, with core indices and leading-sector constituents likely to extend their oscillating upward trend.
Macroeconomy
The recent recovery momentum of U.S. economic growth has exceeded previous market expectations, and the U.S. economy is expected to sustain its resilient performance this year. Our calculations show that the full-year real GDP growth rate in 2026 may reach around 2.5%, a figure significantly higher than the current market consensus of 2.1%. Specifically, there are four major factors driving the relatively robust economic growth of the U.S. in 2026.
First, the overall performance of the newly released economic data has outperformed the previous market consensus, confirming that the resilience of U.S. economic growth in 2026 has a solid foundation for continuation. In terms of economic growth, the U.S. economic growth rate has staged a robust rebound since the second quarter of last year, with the quarter-on-quarter annualized GDP growth rate surging to 4.3% in the third quarter, substantially exceeding the market expectation of 3.3%. As the core indicators for gauging the economy’s underlying momentum, the combined growth rate of private consumption and investment has rebounded to 3%, drawing close to the average level of 3.1% in the second half of 2024, which underscores the still-solid resilience of U.S. domestic demand. In terms of the job market, although the number of nonfarm payrolls in December fell short of expectations with a relatively concentrated industry distribution, the hiring intentions of enterprises surveyed by the National Federation of Independent Business (NFIB) have trended upward overall in recent months. Since December, the weekly initial jobless claims have also beaten expectations on multiple occasions. These signals all indicate that the job market still has room for further improvement, with its downside risks having eased to some extent.
Figure: Real GDP Growth Rate (%, q-o-q, annualized)
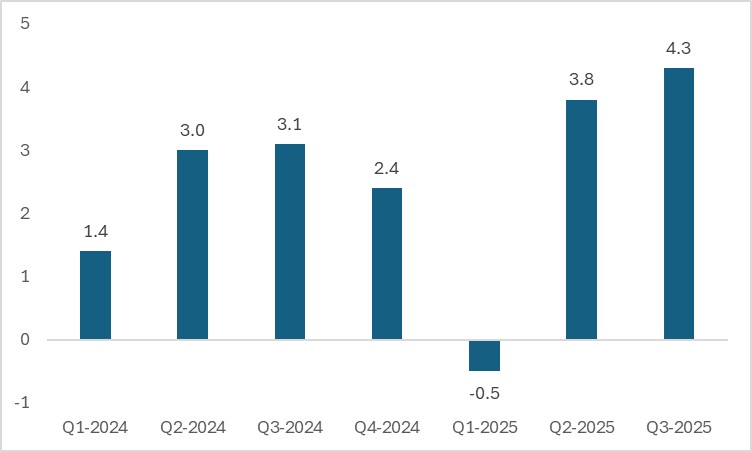
Source: Refinitiv, TradingKey
Second, the duration of the U.S. government shutdown in the fourth quarter of 2025 exceeded market expectations. This event likely exerted a restraining impact on GDP growth in that quarter, and the resulting low-base effect will lift the economic growth figures for 2026, with the GDP growth rates in the first and second quarters of the year set to receive a particularly notable boost. The drag of the government shutdown on the economy in Q4 2025 was transmitted primarily through two channels: first, the suspension of federal employee salaries, the halt of federal government procurement activities, and the pause in Supplemental Nutrition Assistance Program (SNAP) expenditures directly led to a contraction in aggregate demand; second, the work stoppages and production halts among federal employees during the unpaid period caused a reduction in the current output scale. According to estimates from the Congressional Budget Office (CBO), a six-week government shutdown may have trimmed $28 billion from U.S. GDP in Q4 2025 compared to the scenario without a shutdown. The suppressed economic output will be gradually recouped in the first three quarters of 2026, with the respective magnitudes standing at $13 billion, $4 billion and $1 billion. From a growth rate perspective, driven by both the recovery of suppressed demand and the low base in Q4 2025, the quarter-on-quarter annualized GDP growth rate of the U.S. in Q1 2026 is projected to be approximately 2 percentage points higher than in the no-shutdown scenario. In contrast, the growth rates in the remaining three quarters of 2026 will witness a gradual moderation. Based on the above analysis, we judge that the U.S. GDP growth rate in Q4 2025 will fall within the range of 1.0%-1.2%, while the full-year GDP growth rate for 2026 is expected to reach 2.5%.
Third, driven by the "One Big Beautiful Bill" Act, the scale of U.S. fiscal easing in the first half of 2026 is expected to be significantly larger than that in the second half of 2025. This policy effect will be transmitted to the economy primarily through two channels: tax rebates and tax cuts for the household sector. The "One Big Beautiful Bill " Act, which took effect in July 2025, included new tax relief provisions for households. Although these provisions were retroactive to January 2025, the Internal Revenue Service (IRS) did not finalize the revision and optimization of tax returns until 2026, resulting in a notable overpayment of taxes by U.S. households for the 2025 tax year. Given the April 15 tax filing deadline for U.S. residents, the total amount of tax rebates received by the household sector in H1 2026 is projected to increase by $50 billion to $100 billion, accounting for approximately 0.25% of the U.S. GDP in 2026. The actual growth-boosting effect of tax rebates and cuts on the economy hinges on the size of the fiscal multiplier. According to estimates from the Congressional Budget Office (CBO), the median fiscal multiplier for low- and middle-income groups stands at 0.9, whereas that for high-income groups is merely 0.35. Since the high-income groups are set to benefit more substantially from this round of tax cuts, we judge that the overall fiscal multiplier of the policy will be relatively low, at around 0.4. Based on this calculation, the household tax rebate and cut policy is expected to lift the U.S. GDP growth rate by approximately 0.1 percentage points in 2026.
Finally, capital expenditure in the AI sector is expected to surpass the current market consensus in 2026, and "AI+"-related investments—including those in power infrastructure—also stand a chance of outperforming expectations. Our optimistic outlook on AI capital expenditure this year is underpinned by two key supporting rationales. On the one hand, major core market participants have revised up their performance forecasts. Represented by the four hyperscale cloud providers—Amazon Web Services, Microsoft Azure, Google Cloud Platform, and Oracle Cloud Infrastructure—all of them raised their two-year capital expenditure guidance for 2026 and 2027 following the release of their Q3 2025 financial reports. On the other hand, non-listed enterprises have also scaled up their AI-related capital expenditure in tandem, with typical examples including companies like xAI that have expanded their capital expenditure plans. Based on a comprehensive calculation of capital expenditure by U.S. tech giants and non-listed enterprises, the growth rate of AI sector capital expenditure in 2025 may have reached around 80%, substantially higher than the 60% forecast by the market at the start of the year. Excluding relevant import items, AI capital expenditure contributed approximately 0.3 percentage points to U.S. GDP growth in 2025. A recent research report from the Federal Reserve points out that, by taking into account the full-cycle process of project planning, commencement, and completion, the potential project abandonment rate, as well as the inflow pace of future new projects, the short-to-medium-term scale of U.S. data center investment and its growth-boosting effect on the economy can be estimated. Under the baseline assumption of maintaining the growth rate of existing planned projects, the scale of U.S. AI capital expenditure in 2026 will likely hit $464 billion. After excluding import factors, its contribution to GDP growth is expected to rise to 0.4 percentage points, higher than the 2025 level.
In summary, supported by the solid fundamentals of economic growth, the low-base effect from the fourth quarter of 2025, the implementation and entry into force of the "One Big Beautiful Bill" Act, and the sustained climb in capital expenditure growth within the AI sector, we anticipate that the U.S. economy will maintain strong resilience in 2026. A robust economic underpinning will also provide solid support for the steady performance of household consumption. However, it is worth noting that this generally stable consumption trend is likely to show significant divergence across different social strata. Compared with high-income groups, middle- and low-income groups are more reliant on the job market. Furthermore, the household-oriented support under the "One Big Beautiful Bill" Act is centered on tax cuts rather than direct subsidies—a policy design that delivers a more pronounced marginal boost to high-income groups while generating relatively limited stimulus effects for low-income households. At the same time, the wealth effect generated by the rally in U.S. equities is also more concentrated among affluent groups, with its consumption-driving impact far more substantial for this cohort than for low-income groups. Based on the above analysis, we expect that the K-shaped divergence trend in the U.S. consumer market and the overall economy will intensify further in 2026.
Inflation and Federal Reserve Policy
Although the current headline and core CPI in the U.S. remain well above the 2% policy target, the probability of a sharp inflation rebound in 2026 is low. We project that both inflation metrics will stabilize within the range of 2.6% to 2.8% throughout the year. Our baseline scenario for inflation remaining in check is primarily underpinned by three key factors:
First, the pass-through effect of tariffs on inflation has been weaker than previously expected by the market. Currently, the U.S. weighted average import tariff rate has only risen by 9 percentage points compared with the level prior to the Trump administration, falling short of theoretical projections. Coupled with the Trump administration’s tariff cuts on fentanyl imports and tariff exemptions on certain goods such as food, as well as the potential Supreme Court ruling that could invalidate the reciprocal tariff provisions, the current weighted average import tariff rate is expected to have reached its peak and has room for a decline going forward. Additionally, in the current round of trade frictions, enterprises have absorbed nearly 50% of the tariff costs, which has significantly weakened the transmission of tariff pressures to end consumers and further reduced the upward impact of tariffs on inflation. Second, the broad downtrend in international oil prices has exerted an effective dampening effect on inflation. Since November 2025, WTI crude oil prices have been on a downward trajectory. Market expectations have adjusted in tandem: the consensus forecast for 2026 WTI crude oil prices stood at $60.1 per barrel at the end of October 2025, but this projection dropped to $56.8 per barrel in January 2026, representing a 5.8% decline. Should this expectation materialize, it is estimated to pull down the headline CPI by approximately 0.18 percentage points. Third, wage growth has remained in a subdued range, resulting in insufficient upward momentum for inflation. We anticipate that the U.S. job market will continue to show signs of softness ahead. This implies that even if the economy stages a recovery, the risk of inflationary pressures stemming from rising wages will remain relatively limited.
Figure: U.S. Inflation (%, y-o-y)
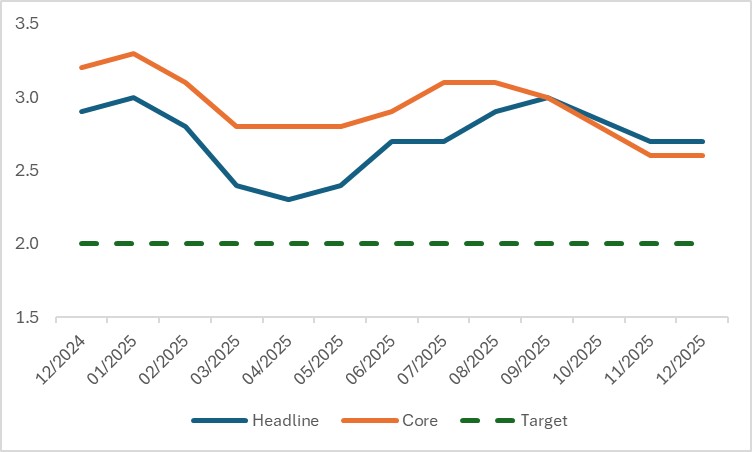
Source: Refinitiv, TradingKey
On the monetary policy front, the resilience exhibited by economic growth has diminished the urgency for the Federal Reserve to implement a prolonged interest rate cut cycle; meanwhile, the moderate and manageable inflation level has ruled out the possibility of the Fed restarting a rate-hiking cycle. Therefore, the current market consensus indicates that the Federal Reserve may initiate one rate cut each in June and October 2026 respectively. In addition, with the exception of Fed Governor Milan, most officials maintain a cautious stance on prolonged interest rate cuts. For instance, Thomas Barkin, President of the Federal Reserve Bank of Richmond, noted that the trends of nonfarm payroll growth and declining unemployment rate are commendable, and given the potential risks to the dual mandates of maximum employment and price stability, the future interest rate policy should adopt a strategy of "targeted fine-tuning". Raphael Bostic, President of the Federal Reserve Bank of Atlanta, stated that significant price and cost pressures persist beyond the tariffs imposed by the Trump administration, and the core focus of the Fed’s policy should be on keeping inflation under control.
Figure: Federal Reserve Benchmark Interest Rate Projections
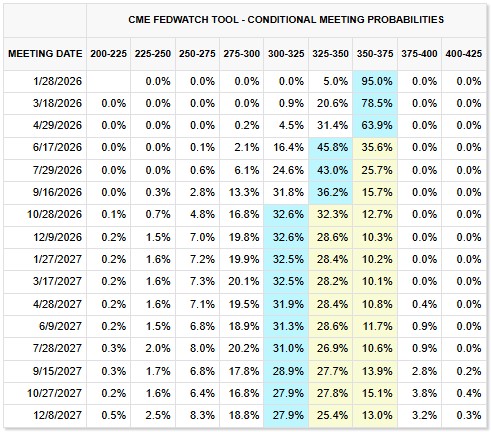
Source: CME Group, TradingKey
U.S. Equity Market Outlook
Against the backdrop of robust economic fundamentals, moderate and manageable inflation, and the Federal Reserve remaining in a rate-cut cycle, the U.S. equity market is expected to maintain an upward trend in 2026. Furthermore, even if there is a certain tendency toward bubble formation in the AI sector of the U.S. stock market at present, it is far from reaching the late stage of a bubble. The late stage of a bubble typically features two core characteristics: first, a severe divergence between asset prices and fundamentals; second, a sustained and rapid expansion in the scale of debt financing. However, based on the current actual situation, on the one hand, although the valuation of U.S. stocks is in a relatively high range, corporate fundamentals remain sound, and the strong market demand for AI computing power coupled with the supply gap among enterprises is sufficient to confirm that the current level of bubbleization in the AI sector is limited. On the other hand, despite the fact that the AI capital expenditure model of tech giants is shifting from cash flow-driven to debt-driven, the current overall debt scale remains within a manageable range, and there are no significant signs of debt fueling bubble expansion yet.
Furthermore, the U.S. dollar and U.S. equities have exhibited a negative correlation, and the sustained depreciation trend of the U.S. dollar in 2026 is expected to provide structural support for U.S. stocks. Specifically, constituent companies of U.S. equity indices have a relatively high proportion of international revenue. A weaker dollar can boost corporate earnings primarily through two channels: first, foreign exchange gains directly increase reported profits; second, it enhances the price competitiveness of enterprises’ overseas products, thereby expanding their overseas market share and revenue scale. According to estimates from Goldman Sachs, every 10% decline in the U.S. Dollar Index could drive an additional 2%-3% growth in the revenue of S&P 500 constituents. In addition, a weaker U.S. dollar is often accompanied by a global liquidity easing environment and a decline in market risk premiums, both of which together form an important pillar supporting the upward revaluation of U.S. equities.
Conclusion
All in all, multiple positive catalysts are generating a synergistic effect, underpinned by the robust growth resilience of the U.S. economy, the clear support from the Federal Reserve’s rate-cut cycle, the fundamental strengths of steady industrialization progress in the AI sector without the formation of a significant valuation bubble, as well as the global capital reallocation dividend brought by the U.S. Dollar Index lingering in a downward trajectory. Against this backdrop, the U.S. equity market is expected to retain room for further upside in 2026, with core indices and leading-sector constituents likely to extend their oscillating upward trend.
Recommended Articles


