USD/CAD holds firm as mixed trade headlines cloud USD outlook

Source Fxstreet
  • USD/CAD trades near the 1.3900 zone in a tight range ahead of the weekend
  • Contradictory US-China tariff headlines and resilient oil prices shape sentiment
  • Resistance is seen at 1.3893 and 1.3986, with support at 1.3855

The USD/CAD pair holds steady around the 1.3900 zone on Friday as markets weigh fresh US-China trade headlines and stronger oil prices against a firmer Greenback. The US Dollar Index (DXY) is trading higher near 99.60, supported by comments from US President Donald Trump suggesting talks with China are ongoing. However, these claims were quickly disputed by the Chinese Foreign Ministry, which said no negotiations were underway, creating confusion and limiting bullish follow-through in USD/CAD.

The mood remains fragile as traders digest mixed trade signals. While Trump claimed progress on negotiations with Beijing, China firmly denied any ongoing tariff consultations, emphasizing that the US should “stop creating confusion.” This contradiction has kept risk appetite in check, weighing on US equity futures and tempering the DXY’s recent rebound.

Oil prices remain a supportive factor for the Canadian Dollar. Brent crude hovers above $68 per barrel after surging earlier this week, buoyed by US sanctions on Iranian oil and reports that China may reduce certain US import tariffs. While OPEC+ production increases are expected in May and possibly June, their net effect is likely to remain limited if offset by compensatory cuts, according to Commerzbank analysts.

Technical outlook


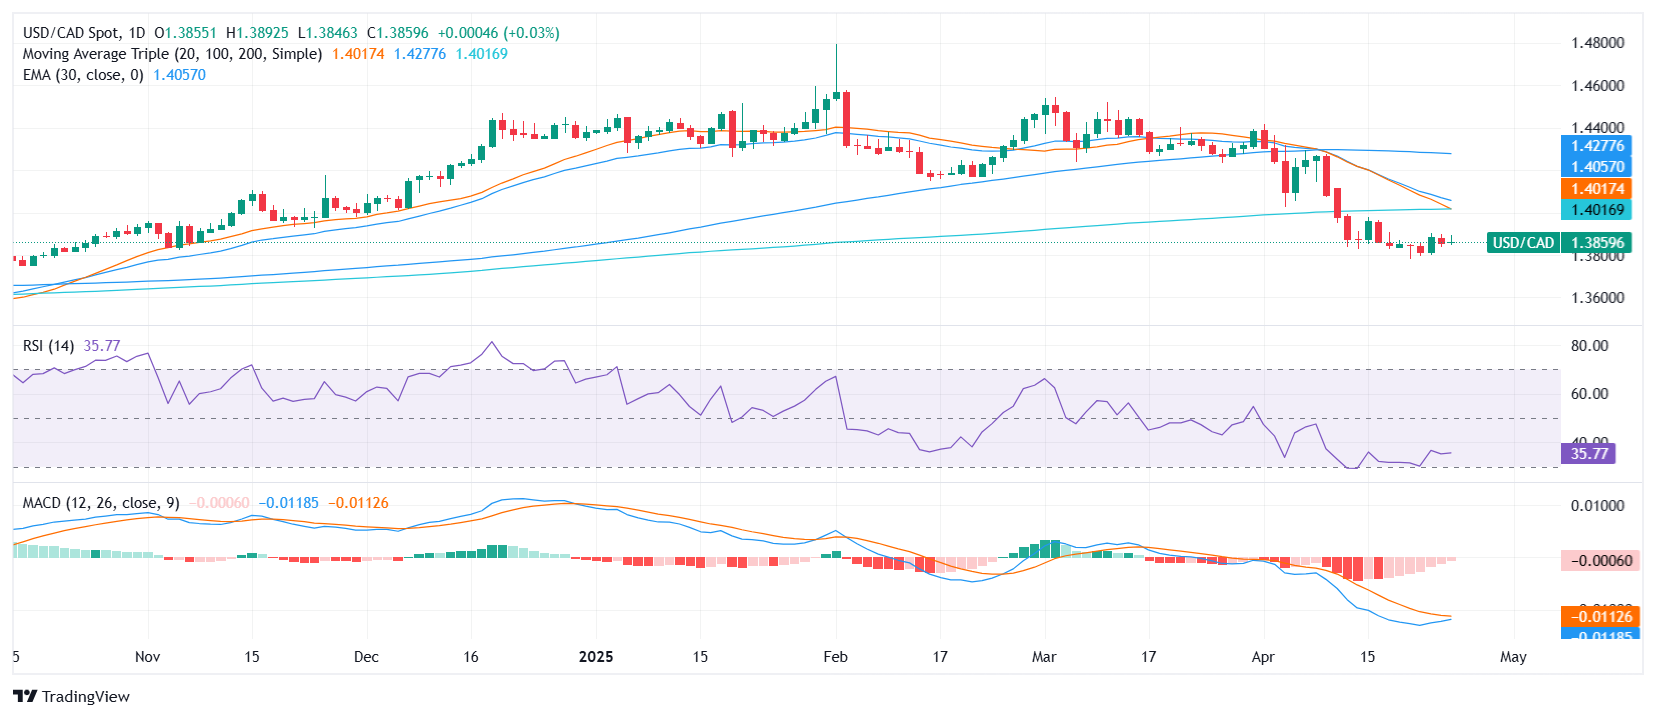
USD/CAD is flashing an overall bearish signal, trading flat near 1.3900 and consolidating within the intraday range of 1.3846 to 1.3893. The Relative Strength Index (RSI) sits neutrally at 36, while the Moving Average Convergence Divergence (MACD) shows a sell signal, hinting at downward pressure.

Momentum indicators are mixed. The Stochastic RSI Fast (near 41) and the Bull Bear Power (close to 0) both suggest indecision, failing to confirm a directional bias. However, trend-following signals remain bearish. The 20-day, 100-day, and 200-day Simple Moving Averages at 1.4017, 1.4270, and 1.4009 respectively all slope lower, reinforcing the negative tone. Bearish cues are also seen in the 10-day EMA at 1.3893 and the 10-day SMA at 1.3863.

Support rests at 1.3855, just above this week’s low. A break below would expose 1.3800 and 1.3745 next. On the upside, resistance is found at 1.3863, 1.3893, and the psychological 1.3986 zone. Unless USD strength regains momentum or oil prices pull back sharply, the bias for USD/CAD remains skewed to the downside.

Disclaimer: For information purposes only. Past performance is not indicative of future results.
placeholder
Nearly $2 Billion Wiped Out in Crypto Liquidations Amid Brutal Sell-OffThe crypto market experienced nearly $2 billion in liquidations over the past 24 hours, as the total market capitalization dropped below $3 trillion for the first time in five months.Bitcoin (BTC) alo
Author  Beincrypto
Nov 21, Fri
The crypto market experienced nearly $2 billion in liquidations over the past 24 hours, as the total market capitalization dropped below $3 trillion for the first time in five months.Bitcoin (BTC) alo
placeholder
Market Meltdown: BTC, ETH, and XRP Capitulate as Bears Seize ControlBitcoin trades around $85,900 after breaking below $86,000, with Ethereum under $2,791 and XRP below $1.99 as BTC, ETH and XRP extend weekly losses of 8–10%, forcing traders to focus on supports at $85,000, $2,749 and $1.77 for clues on whether this sell-off has further to run.
Author  Mitrade
Nov 21, Fri
Bitcoin trades around $85,900 after breaking below $86,000, with Ethereum under $2,791 and XRP below $1.99 as BTC, ETH and XRP extend weekly losses of 8–10%, forcing traders to focus on supports at $85,000, $2,749 and $1.77 for clues on whether this sell-off has further to run.
placeholder
Bitcoin's Drop to $86K Approaches 'Max Pain' Zone, Yet Presents Potential Buying OpportunityAnalysts identify the $84,000 to $73,000 range as Bitcoin's likely "max pain" territory where capitulation may occur.
Author  Mitrade
Nov 21, Fri
Analysts identify the $84,000 to $73,000 range as Bitcoin's likely "max pain" territory where capitulation may occur.
placeholder
Whale Dump Meets Quantum Panic: Bitcoin Slips to $86,000 and Blows $220 Million LongsBitcoin fell below $87,000 on November 20, 2025, amid a storm of quantum security fears and $1.3 billion whale capitulation. In the process, it blew almost $220 million in long positions out of the wa
Author  Beincrypto
Nov 21, Fri
Bitcoin fell below $87,000 on November 20, 2025, amid a storm of quantum security fears and $1.3 billion whale capitulation. In the process, it blew almost $220 million in long positions out of the wa
placeholder
EUR/USD dives further as traders pare back Fed cuts betsEUR/USD extends losses for the fifth consecutive day and trades at 1.1520 at the time of writing on Thursday after a sharp reversal from levels near 1.1600 on Wednesday.
Author  FXStreet
Nov 20, Thu
EUR/USD extends losses for the fifth consecutive day and trades at 1.1520 at the time of writing on Thursday after a sharp reversal from levels near 1.1600 on Wednesday.
goTop
quote