

Canary Capital files for a staked SEI ETF in Delaware
- SEI stabilizes on Thursday after gaining over 10% so far this week.
- Canary Capital registered for a staked SEI ETF in Delaware on Wednesday.
- This move signals growing institutional interest in the Sei network.
Sei price (SEI) stabilizes near $0.19 at the time of writing on Thursday after rallying over 10% so far this week amid improved risk-on sentiment due to United States (US) President Donald Trump softening stance on the Federal Reserve (Fed) Chair Jerome Powell and China. Moreover, asset management firm Canary Capital registered for a staked SEI Exchange Traded Fund (ETF) in Delaware on Wednesday, which signals growing institutional interest in the Sei network.
Sei sees growing institutional interest
Sei, a layer 1 blockchain network, is seeing growing institutional interest, evidenced by Canary Capital’s registration for a staked SEI ETF in Delaware on Wednesday. According to the Delaware official website, this filing has a file number of 10171975, as shown below.
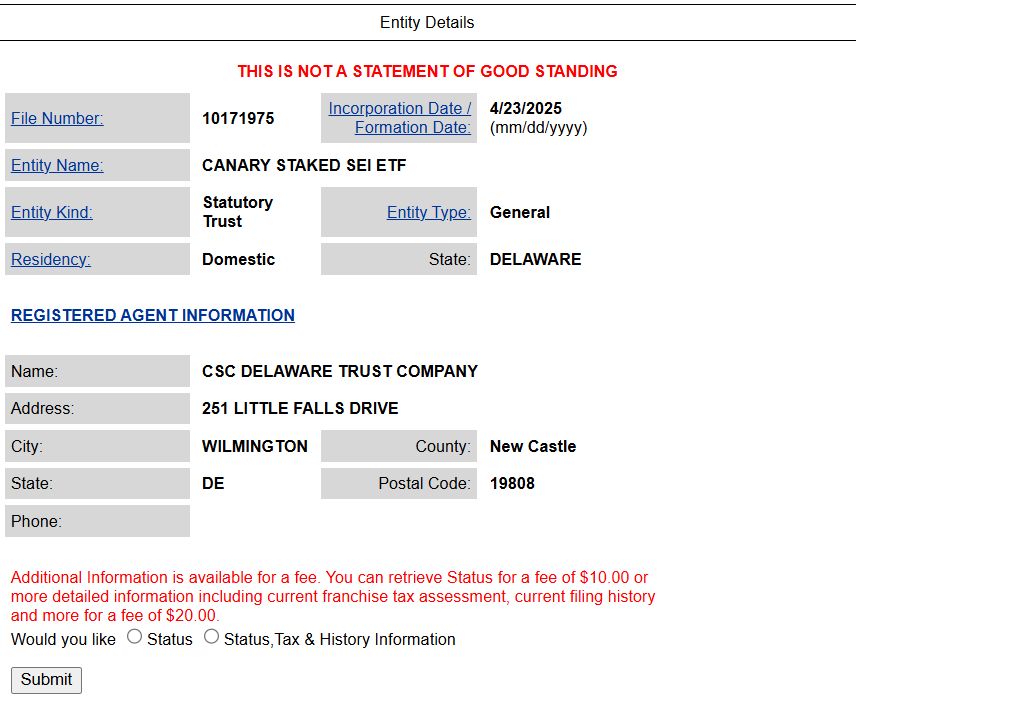
Canary Capital staked SEI ETF registration. Source: Delaware
Sei token price rallied slightly by nearly 3% following the news, and at the time of writing on Thursday, it hovers around $0.19.
The staked ETFs are a form that combines traditional finance with crypto staking, allowing investors to gain exposure to SEI’s price while earning yield through staking. In this process, tokens are locked to support blockchain operations.
A filing like this is generally considered a bullish sign for the Sei network and its token’s price in the long term, as an ETF can make it easier for traditional investors to gain exposure to SEI without needing to purchase and store the cryptocurrency directly. Moreover, approving an ETF could lend more legitimacy to SEI and increase liquidity.
Apart from the recent Sei filing, Canary Capital has targeted altcoins and meme coins, such as Sui (SUI), Hedera (HBAR), and Pudgy Penguins (PENGU). Moreover, in a previous report, FXStreet highlighted that dozens of crypto-related ETFs are awaiting approval from the US Securities and Exchange Commission (SEC).
Sei Price Forecast: SEI faces resistance around the 50-day EMA
Sei price broke above a descending trendline (drawn by joining multiple highs since the end of January) on Tuesday and rallied 10.34% until the next day. At the time of writing on Thursday, it stabilizes near the 50-day Exponential Moving Average (EMA) of around $0.19.
If SEI breaks and closes above the 50-day EMA on a daily basis, it could extend the rally to retest its next daily resistance at $0.21. A successful close above this level could extend additional gains to reach its March 6 high of $0.24.
The Relative Strength Index (RSI) on the daily chart reads 58, above its neutral level of 50, indicating bullish momentum. The Moving Average Convergence Divergence (MACD) indicator also showed a bullish crossover on the daily chart last week, giving a buy signal. It also shows rising green histogram bars above its neutral level of zero, suggesting bullish momentum and the continuation of an upward trend.
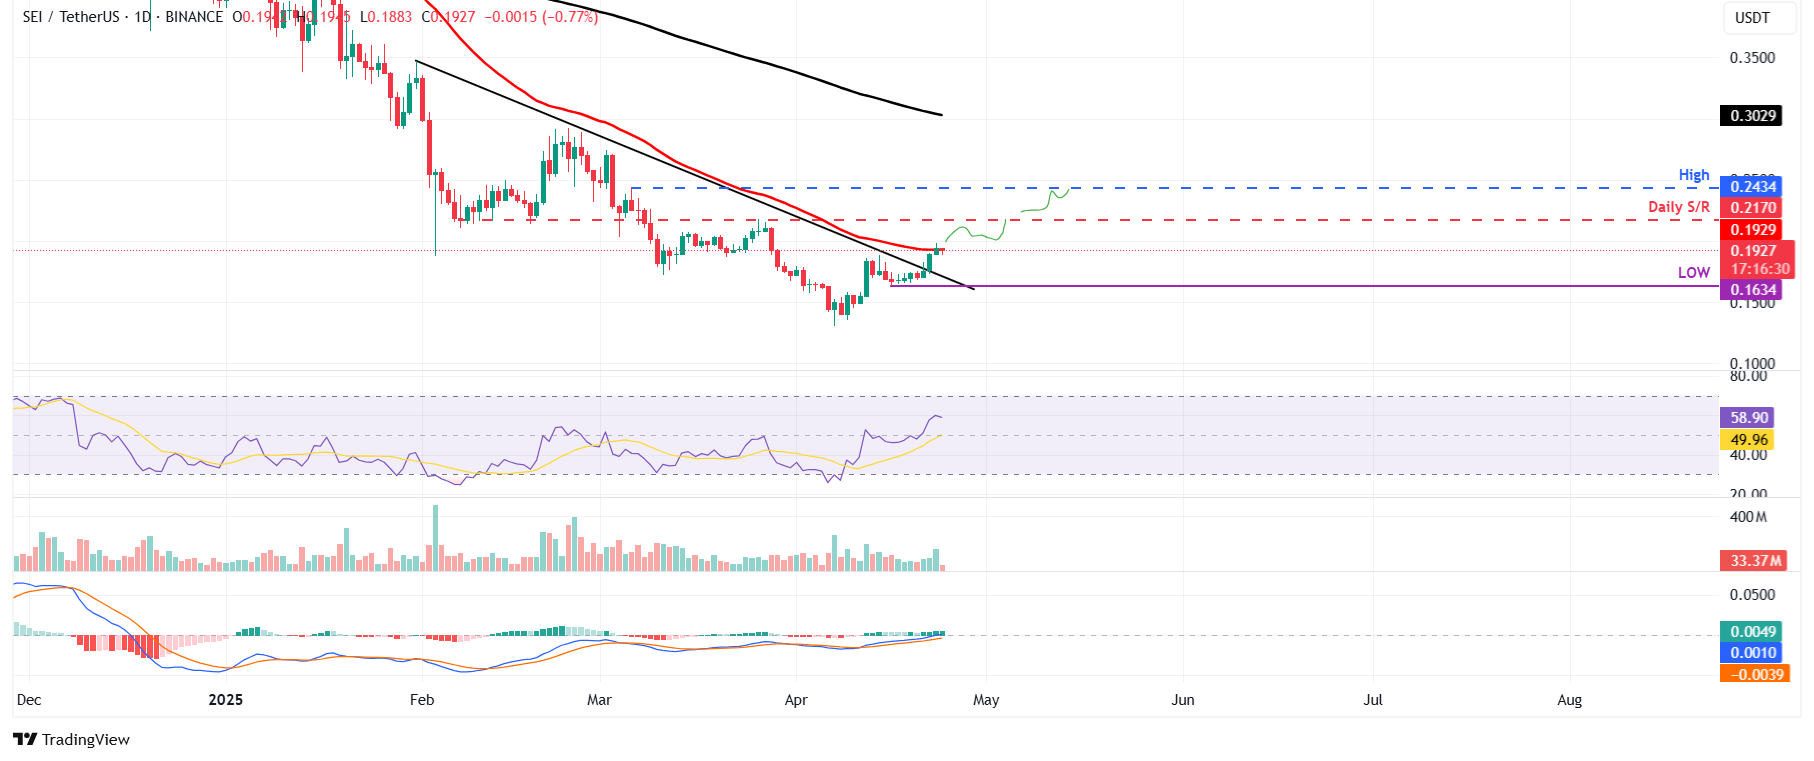
SEI/USDT daily chart
On the other hand, if SEI fails to break above the 50-day EMA and faces a correction, it could extend the decline to retest its April 16 low of $0.16, which roughly coincides with the previously broken descending trendline.
Recommended Articles


