Bitcoin Weekly Forecast: BTC holds steady, Fed warns of tariffs’ impact, as Gold hits new highs 

Source Fxstreet
  • Bitcoin price steadied this week, holding $84,000 support despite lingering macroeconomic uncertainty.
  • Fed Chair Jerome Powell highlights the impact of larger-than-expected tariffs, high inflation risk, and slow economic growth.
  • Gold upholds its bullish streak and hits new highs at $3,357 as investors sidestep Bitcoin as a safe-haven asset.
  • BTC shows immense strength amid a developing bullish structure for a breakout, targeting $97,938.

Bitcoin (BTC) price consolidates above $84,000 on Friday, a short-term support that has gained significance this week. The world's largest cryptocurrency by market capitalization continued to weather storms caused by United States (US) President Donald Trump's incessant trade war with China after pausing reciprocal tariffs for 90 days on April 9 for other countries. Bitcoin exchanges hands at $84,605 at the time of writing on Friday, with its technical structure suggesting that a breakout may soon be imminent. 

Fed Chair warns tariffs could have a larger impact on the US economy

Federal Reserve (Fed) Chair Jerome Powell expressed concerns about the current economic conditions, suggesting that the central bank could find itself in a dilemma between keeping inflation in check and supporting economic growth. "We may find ourselves in the challenging scenario in which our dual-mandate goals are in tension," Powell said in his remarks at the Economic Club of Chicago on Wednesday.

Regarding interest rates, Powell said the central bank will respond to incoming data to inform adjustments to the current policy stance. However, if inflation spikes, the Fed is ready to hold the rates steady or consider increasing them. A slower economic growth pattern would lead to lower interest rates.

President Trump's tariffs "are highly likely to generate at least a temporary rise in inflation." Powell anticipates that the tariffs' impact will be larger than expected and may result in persistent inflation.

Following the remarks, President Trump launched a direct attack on Jerome Powell in a Truth Social post, accusing the Fed Chair of being "too late and wrong." According to the President, the Federal Reserve should have already cut interest rates because "the USA is getting rich on tariffs." Trump added that it is time for Powell to step back and exit the Fed.

Gold soars spotlighting Bitcoin's perceived safe-haven status

Gold prices outperformed amid lingering uncertainty over tariffs and the trade war between China and the US. The yellow metal reached a new all-time high at $3,357 per ounce on Thursday before pulling back to $3,327 at the time of writing.

While Bitcoin has steadied since the April 7 low at $74,572, its upside remains capped under $85,000. However, outflows from Bitcoin Exchange Traded Funds (ETFs), as observed since April 1, suggest that investors prefer to reduce exposure, possibly buying Gold. In a fortnight, spot BTC ETFs recorded only four days of inflows compared to nine days of outflows, per SoSoValue data.

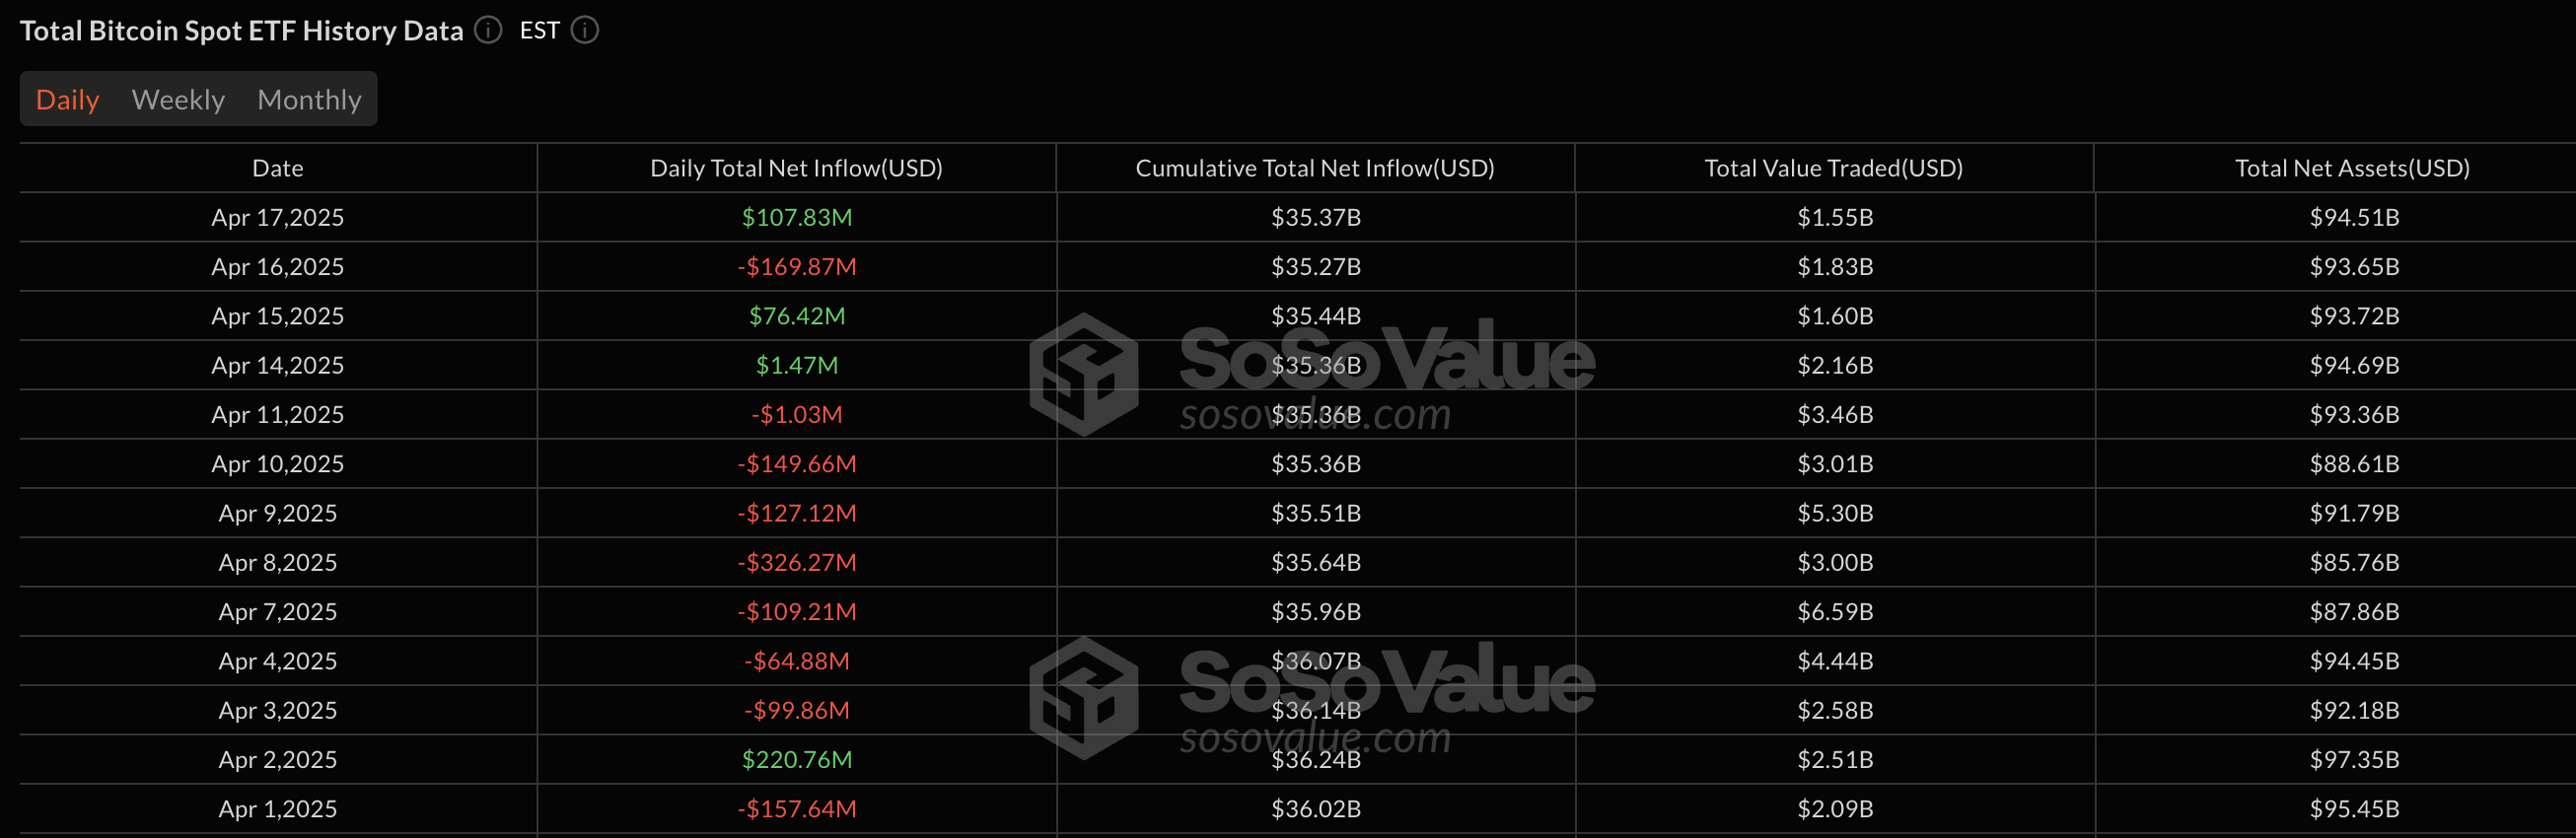
Bitcoin ETF data | Source: SoSoValue

On the positive side, Bitcoin continues to outpace equities, weathering volatility as stock markets tumble amid President Trump's tariff policy. China was slapped with a massive 245% tariff this week. Technology stocks like NVIDIA suffered larger drawdowns as China expanded the trade war to rare earth metals.

"Though it did not attract a safe-haven bid like gold, which hit a record $3,357, BTC's relative stability stood out in a week marked by increasing global uncertainty," the K33 Research weekly report highlighted.

Bitcoin price could move 15% to $97,938

Bitcoin's price is slightly below the 50-day and 200-day Exponential Moving Averages (EMAs) at the time of writing on Friday, as bulls attempt to push for a breakout from the falling wedge pattern shown in the daily chart.

A falling wedge signals a potential bullish reversal for Bitcoin's price, suggesting bearish momentum is fading. If validated with a breakout above the upper trendline resistance, expect a 15% rally to $97,938. Traders can buy on the breakout, setting stop-losses below this trendline. The target represents the distance between the pattern's widest points, extrapolated above the breakout point.

A crucial bullish point to consider for Bitcoin is the buy signal from the Moving Average Convergence Divergence (MACD), which manifested when the MACD line (blue) crossed above the signal line (red) on April 12. At the same time, the Relative Strength Index (RSI) indicator crossed above the center line and held at 51.97, pointing at a potentially strong bullish momentum.

Therefore, a break above the wedge pattern accompanied by high trading volume could mark the beginning of Bitcoin's return to the $90,000 range.

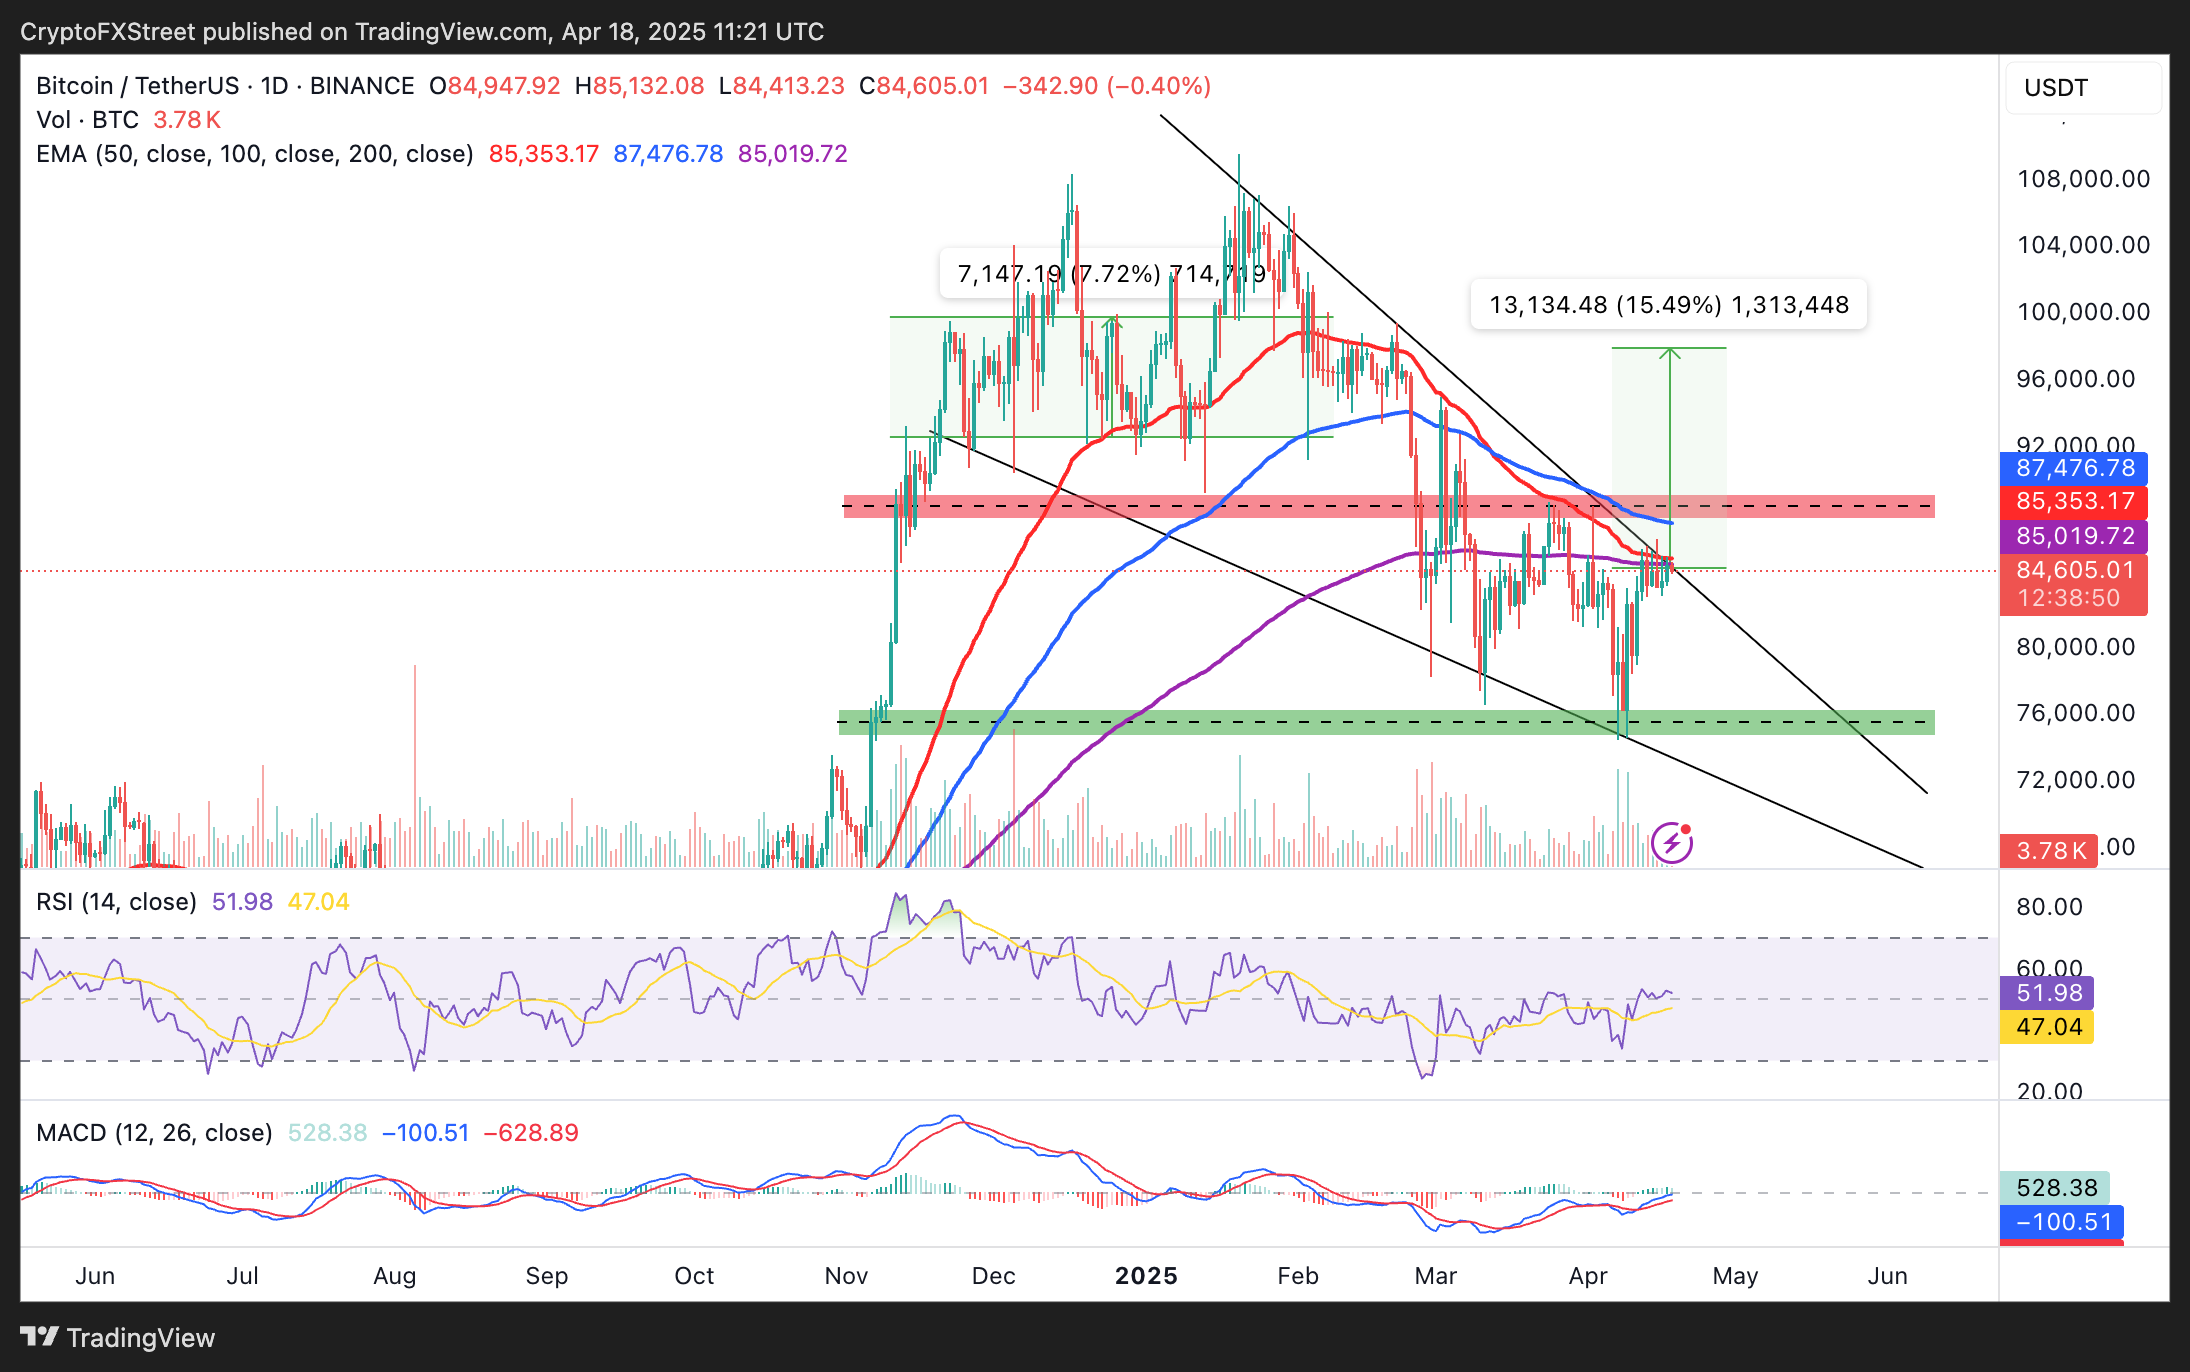
BTC/USDT daily chart 

On the contrary, if bulls fail to breach the wedge pattern trendline resistance and seek support above the 50-day and 200-day EMAs, traders may lack the conviction to hold their positions. In that case, planning for a sweep through liquidity at $80,000 would be prudent. If selling activities surge, a drop to April's low of $74,508 would be on the cards.

Disclaimer: For information purposes only. Past performance is not indicative of future results.
placeholder
Ethereum (ETH) Price Closes Above $3,900 — Is a New All-Time High Possible Before 2024 Ends?Once again, the price of Ethereum (ETH) has risen above $3,900. This bounce has hinted at a further price increase for the altcoin before the end of the year.
Author  Beincrypto
Dec 17, 2024
Once again, the price of Ethereum (ETH) has risen above $3,900. This bounce has hinted at a further price increase for the altcoin before the end of the year.
placeholder
Gold Price Forecast: XAU/USD drifts higher above $4,200 as Fed delivers expected cutGold price (XAU/USD) gains momentum to around $4,235 during the early Asian session on Thursday. The precious metal extends its upside after the US Federal Reserve (Fed) delivered an expected third consecutive interest rate cut and maintained its outlook for just one cut in 2026.
Author  FXStreet
Dec 11, Thu
Gold price (XAU/USD) gains momentum to around $4,235 during the early Asian session on Thursday. The precious metal extends its upside after the US Federal Reserve (Fed) delivered an expected third consecutive interest rate cut and maintained its outlook for just one cut in 2026.
placeholder
Ethereum Price Slips Lower — $3,000 Looms as the Key BattlegroundEthereum is attempting to recover from a $3,026 low but remains below $3,200 and the 100-hour SMA, with a bearish trend line near $3,175 capping rebounds as bulls need a clean break above $3,200 to target $3,250–$3,400, while a drop below $3,050 risks a retest of $3,000 and $2,940.
Author  Mitrade
Dec 15, Mon
Ethereum is attempting to recover from a $3,026 low but remains below $3,200 and the 100-hour SMA, with a bearish trend line near $3,175 capping rebounds as bulls need a clean break above $3,200 to target $3,250–$3,400, while a drop below $3,050 risks a retest of $3,000 and $2,940.
placeholder
Macro Analysts: Hawkish Japan Could Push Bitcoin Below $70KAnalysts predict Bitcoin may face further declines towards the $70,000 mark if the Bank of Japan raises interest rates as expected.
Author  Mitrade
Dec 15, Mon
Analysts predict Bitcoin may face further declines towards the $70,000 mark if the Bank of Japan raises interest rates as expected.
placeholder
Bitcoin Slides 5% as Sellers Lean In — Can BTC Reclaim $88,000?Bitcoin has dropped back below $88,000 after rolling over from $90,500, with price still trading under the 100-hour Simple Moving Average. The sell-off found a floor at $85,151, and BTC is now consolidating near that base, but rebounds are facing pressure from a bearish trend line around $89,000. Bulls need to retake $88,000–$89,000 to ease downside risk; failure to do so keeps $85,500–$85,000 and then $83,500 in play, with $80,000 as the deeper “line in the sand.” Bitcoin (BTC) is back in damage-control mode after a sharp pullback wiped out recent gains. The price failed to reclaim the $90,000–$90,500 band, rolled over, and slid through $88,500 before briefly dipping under $87,000. Buyers did show up around $85,000, but the rebound so far looks more like stabilization than a clear trend reversal. Bitcoin dips hard, finds a bid near $85,000(h3) BTC’s latest move lower began when it couldn’t build follow-through above $90,000 and $90,500. Once that upside stalled, sellers took control and pushed price down through $88,500. The slide accelerated enough to spike below $87,000, but the market didn’t free-fall. Bulls defended the $85,000 zone, printing a low at $85,151. Since then, Bitcoin has been consolidating below the 23.6% Fibonacci retracement of the drop from the $93,560 swing high to the $85,151 low — a clue that the bounce is still shallow and that sellers haven’t fully backed off yet. Structurally, BTC is still on the back foot: It’s trading below $88,000, and It remains below the 100-hour Simple Moving Average, keeping short-term trend pressure pointed downward. Resistance is layered, and $89,000 is the problem area(h3) If bulls try to turn this into a recovery, they’ll have to climb through multiple ceilings in quick succession. First, BTC faces resistance around $87,150, followed by a more meaningful barrier near $87,500. From there, the market’s attention snaps back to $88,000 — the level BTC just lost and now needs to reclaim. A close back above $88,000 would improve the tone, but it doesn’t solve the bigger issue: there’s a bearish trend line on the hourly BTC/USD chart (Kraken feed) with resistance near $89,000, which also lines up with the next technical hurdle. If BTC can push through $89,000 and hold, the rebound could extend toward $90,000, with follow-through targets at $91,000 and $91,500. But until price clears that $88,000–$89,000 zone, rallies are at risk of being sold rather than chased. If BTC fails to reclaim resistance, the downside path is clear(h3) The near-term bear case is simple: if Bitcoin can’t climb back above the $87,000 area and keep traction, sellers may attempt another leg lower. Support levels line up like this: Immediate support: $85,500 First major support: $85,000 Next support: $83,500 Then $82,500 in the near term Below that, the major “don’t break this” level is still $80,000. If BTC slips under $80,000, the risk of acceleration to the downside increases significantly — not because it’s magic, but because it’s the kind of psychological and structural level that tends to trigger forced de-risking. Indicators: momentum still leans bearish(h3) The intraday indicators aren’t offering much comfort yet: Hourly MACD is losing pace in the bearish zone. Hourly RSI remains below 50, suggesting sellers still have the upper hand on short timeframes. So while the $85,000 defense held for now, the market hasn’t flipped bullish — it’s just stopped bleeding.
Author  Mitrade
22 hours ago
Bitcoin has dropped back below $88,000 after rolling over from $90,500, with price still trading under the 100-hour Simple Moving Average. The sell-off found a floor at $85,151, and BTC is now consolidating near that base, but rebounds are facing pressure from a bearish trend line around $89,000. Bulls need to retake $88,000–$89,000 to ease downside risk; failure to do so keeps $85,500–$85,000 and then $83,500 in play, with $80,000 as the deeper “line in the sand.” Bitcoin (BTC) is back in damage-control mode after a sharp pullback wiped out recent gains. The price failed to reclaim the $90,000–$90,500 band, rolled over, and slid through $88,500 before briefly dipping under $87,000. Buyers did show up around $85,000, but the rebound so far looks more like stabilization than a clear trend reversal. Bitcoin dips hard, finds a bid near $85,000(h3) BTC’s latest move lower began when it couldn’t build follow-through above $90,000 and $90,500. Once that upside stalled, sellers took control and pushed price down through $88,500. The slide accelerated enough to spike below $87,000, but the market didn’t free-fall. Bulls defended the $85,000 zone, printing a low at $85,151. Since then, Bitcoin has been consolidating below the 23.6% Fibonacci retracement of the drop from the $93,560 swing high to the $85,151 low — a clue that the bounce is still shallow and that sellers haven’t fully backed off yet. Structurally, BTC is still on the back foot: It’s trading below $88,000, and It remains below the 100-hour Simple Moving Average, keeping short-term trend pressure pointed downward. Resistance is layered, and $89,000 is the problem area(h3) If bulls try to turn this into a recovery, they’ll have to climb through multiple ceilings in quick succession. First, BTC faces resistance around $87,150, followed by a more meaningful barrier near $87,500. From there, the market’s attention snaps back to $88,000 — the level BTC just lost and now needs to reclaim. A close back above $88,000 would improve the tone, but it doesn’t solve the bigger issue: there’s a bearish trend line on the hourly BTC/USD chart (Kraken feed) with resistance near $89,000, which also lines up with the next technical hurdle. If BTC can push through $89,000 and hold, the rebound could extend toward $90,000, with follow-through targets at $91,000 and $91,500. But until price clears that $88,000–$89,000 zone, rallies are at risk of being sold rather than chased. If BTC fails to reclaim resistance, the downside path is clear(h3) The near-term bear case is simple: if Bitcoin can’t climb back above the $87,000 area and keep traction, sellers may attempt another leg lower. Support levels line up like this: Immediate support: $85,500 First major support: $85,000 Next support: $83,500 Then $82,500 in the near term Below that, the major “don’t break this” level is still $80,000. If BTC slips under $80,000, the risk of acceleration to the downside increases significantly — not because it’s magic, but because it’s the kind of psychological and structural level that tends to trigger forced de-risking. Indicators: momentum still leans bearish(h3) The intraday indicators aren’t offering much comfort yet: Hourly MACD is losing pace in the bearish zone. Hourly RSI remains below 50, suggesting sellers still have the upper hand on short timeframes. So while the $85,000 defense held for now, the market hasn’t flipped bullish — it’s just stopped bleeding.
goTop
quote