


Mexican Peso surges as Trump-Sheinbaum call eases trade tensions
- Mexican Peso soars as USD/MXN drops 1.14% amid weaker US Dollar.
- Trump and Sheinbaum describe call as “very productive,” boosting sentiment and reducing near-term tariff risks.
- USD weakens as Trump criticizes Fed’s delayed rate cuts, citing falling oil and grocery prices.
The Mexican Peso rallied against the US Dollar on Thursday after US President Donald Trump and Mexican President Claudia Sheinbaum held a phone call that both said was “very productive.” This and a weaker Greenback sent the USD/MXN drifting lower, exchanging hands at 19.69, down 1.14%.
Trading in Mexico is closed in observance of Easter holidays. Although Mexico’s economic docket remained absent this week, it will gather traction next week with the release of Retail Sales, mid-month inflation for April, and Economic Activity data.
So far, Mexico has dodged additional tariffs that have already been imposed since March 4, when Trump enacted duties of 25% on most imports, including steel, aluminum, cars and auto parts. On April 14, the White House decided to apply 21% tariffs on tomatoes.
Across the border, US President Trump complained about US Federal Reserve (Fed) Chair Jerome Powell, saying that the Fed is “too late” on slashing rates due to decreased oil and grocery prices.
US jobs data and Building Permits fared better than expected. On the contrary, Housing Starts plunged, indicating that housing construction is slowing down.
In the docket, Mexico will feature Retail Sales, mid-month inflation for April, and economic activity for February until next week.
Daily digest market movers: Mexican Peso advances amid absent economic docket
- As Governor Victoria Rodriguez Ceja said, Banco de Mexico (Banxico) is ready to continue easing policy. However, a slowdown in Retail Sales and softer inflation figures would justify Banxico’s 50-basis-point interest rate cut at the May meeting.
- Mexico’s Economic Activity indicator, which displays monthly growth figures, would further confirm Banxico’s decision. In January, activity contracted by -0.2% on a monthly basis and -0.1% on an annual basis.
- If the data comes in softer, Banxico could reduce rates as expected, cutting the interest rate differential between Mexico and the US. Although it should be positive for the US dollar, sending the USD/MXN to a rally, uncertainty on the markets, and traders ditching the US Dollar could cap the exotic pair’s upside.
- US Initial Jobless Claims for the week ending April 12 were 215K, down from 224K and below the 225K forecast — an encouraging sign for the labor market.
- US Building Permits rose 1.6%, from 1.459 million to 1.482 million, beating expectations of 1.45 million. However, Housing Starts disappointed, dropping sharply from 1.494 million to 1.324 million, signaling weakness in residential construction activity.
- Money market players had priced in 86 bps of Fed easing toward the end of 2025. The first cut is expected in July.
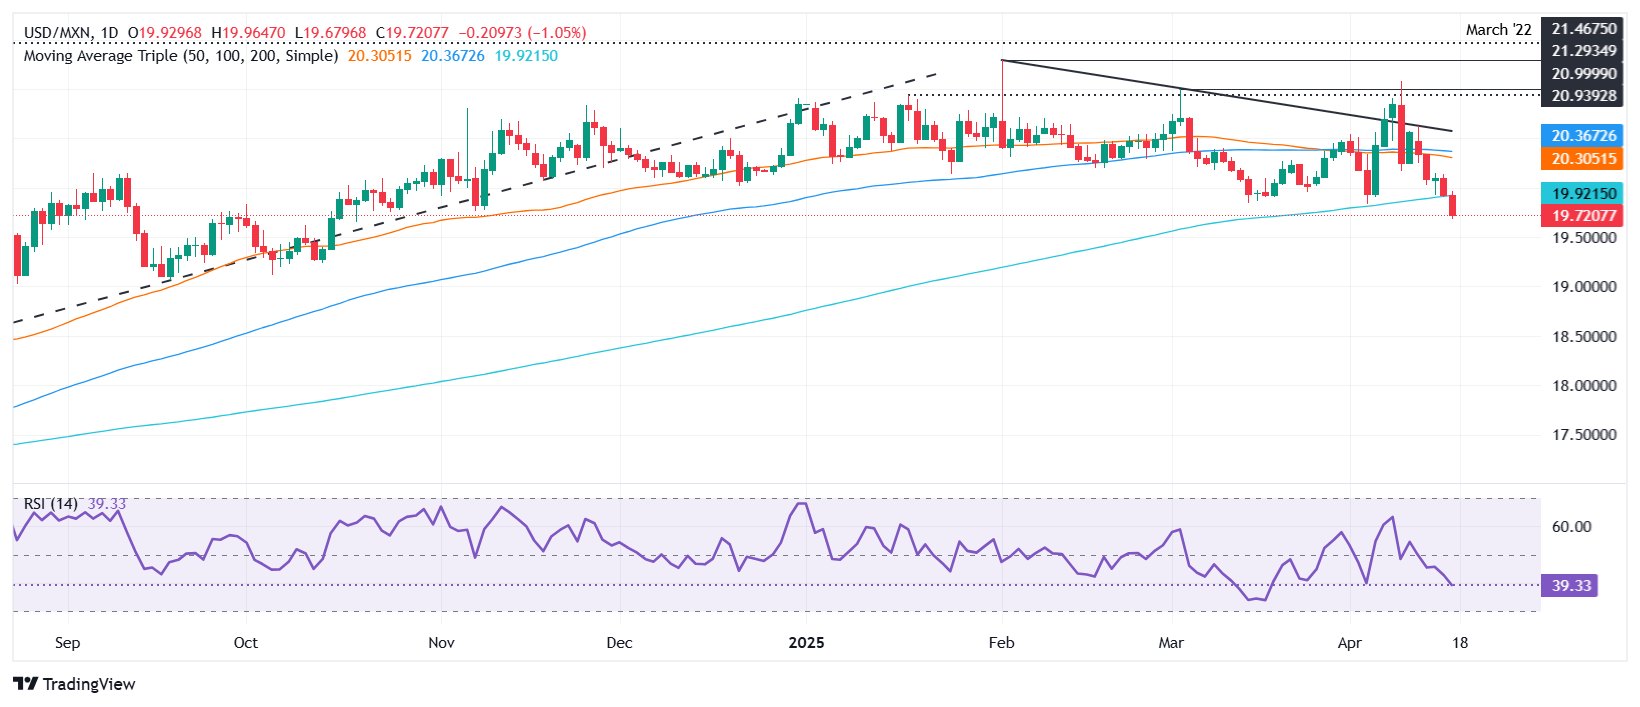
USD/MXN technical outlook: Mexican Peso rallies as USD/MXN tumbles below 200-day SMA
The USD/MXN uptrend is questionable with sellers sending the pair drifting below the 20.00 figure and clearing the 200-day Simple Moving Average (SMA) of 19.87. The Relative Strength Index (RSI) turned bearish, so a further confirmation of a daily close beneath the 200-day SMA would pave the way to challenge 19.50. In that outcome, the following support would be the 19.00 figure.
Conversely, if buyers push the USD/MXN exchange rate above 20.00, this could open the door to test the April 14 high of 20.29, which would open the door to the 50-day and 100-day SMA confluence near 20.29–20.35, followed by the 20.50 resistance.
Mexican Peso FAQs
The Mexican Peso (MXN) is the most traded currency among its Latin American peers. Its value is broadly determined by the performance of the Mexican economy, the country’s central bank’s policy, the amount of foreign investment in the country and even the levels of remittances sent by Mexicans who live abroad, particularly in the United States. Geopolitical trends can also move MXN: for example, the process of nearshoring – or the decision by some firms to relocate manufacturing capacity and supply chains closer to their home countries – is also seen as a catalyst for the Mexican currency as the country is considered a key manufacturing hub in the American continent. Another catalyst for MXN is Oil prices as Mexico is a key exporter of the commodity.
The main objective of Mexico’s central bank, also known as Banxico, is to maintain inflation at low and stable levels (at or close to its target of 3%, the midpoint in a tolerance band of between 2% and 4%). To this end, the bank sets an appropriate level of interest rates. When inflation is too high, Banxico will attempt to tame it by raising interest rates, making it more expensive for households and businesses to borrow money, thus cooling demand and the overall economy. Higher interest rates are generally positive for the Mexican Peso (MXN) as they lead to higher yields, making the country a more attractive place for investors. On the contrary, lower interest rates tend to weaken MXN.
Macroeconomic data releases are key to assess the state of the economy and can have an impact on the Mexican Peso (MXN) valuation. A strong Mexican economy, based on high economic growth, low unemployment and high confidence is good for MXN. Not only does it attract more foreign investment but it may encourage the Bank of Mexico (Banxico) to increase interest rates, particularly if this strength comes together with elevated inflation. However, if economic data is weak, MXN is likely to depreciate.
As an emerging-market currency, the Mexican Peso (MXN) tends to strive during risk-on periods, or when investors perceive that broader market risks are low and thus are eager to engage with investments that carry a higher risk. Conversely, MXN tends to weaken at times of market turbulence or economic uncertainty as investors tend to sell higher-risk assets and flee to the more-stable safe havens.
Recommended Articles


