
Can FTX’s 186,000 unstaked SOL dampen Solana price breakout hopes?
- FTX/Alameda unstake 186,000 SOL worth approximately $21.61 million from the staking account.
- The staking wallet still holds 5.36 million SOL, worth around $621.61 million.
- Solana price could experience volatility if FTX offloads unstaked SOL in the open market.
- Solana shows resilience at $116.00, but a 3-month descending trendline resistance could challenge the uptrend.
Solana (SOL) price edges higher and trades at $117.31 at the time of writing on Friday, marking a 3.4% increase from the $112.80 open. The smart contracts token corrected lower the previous day, following a sharp recovery to $120 induced by United States (US) President Donald Trump’s 90-day tariff pause on Wednesday. SOL flaunts an improving technical structure; however, news that a wallet linked to the bankrupt FTX exchange and its trading arm Alameda Research has unstaked 186,326 SOL could increase volatility.
FTX unstakes Solana
According to the network’s blockchain explorer, Solscan, a wallet belonging to FTX and its trading company Alameda Research, unlocked 186,326 SOL worth around $21.61 million from the staking contract on Friday. No further action has been taken; however, it is prudent for traders to stay alert. The FTX and Alameda staking wallet still holds 5.36 million SOL, worth approximately $621.76 million per the current exchange rate.
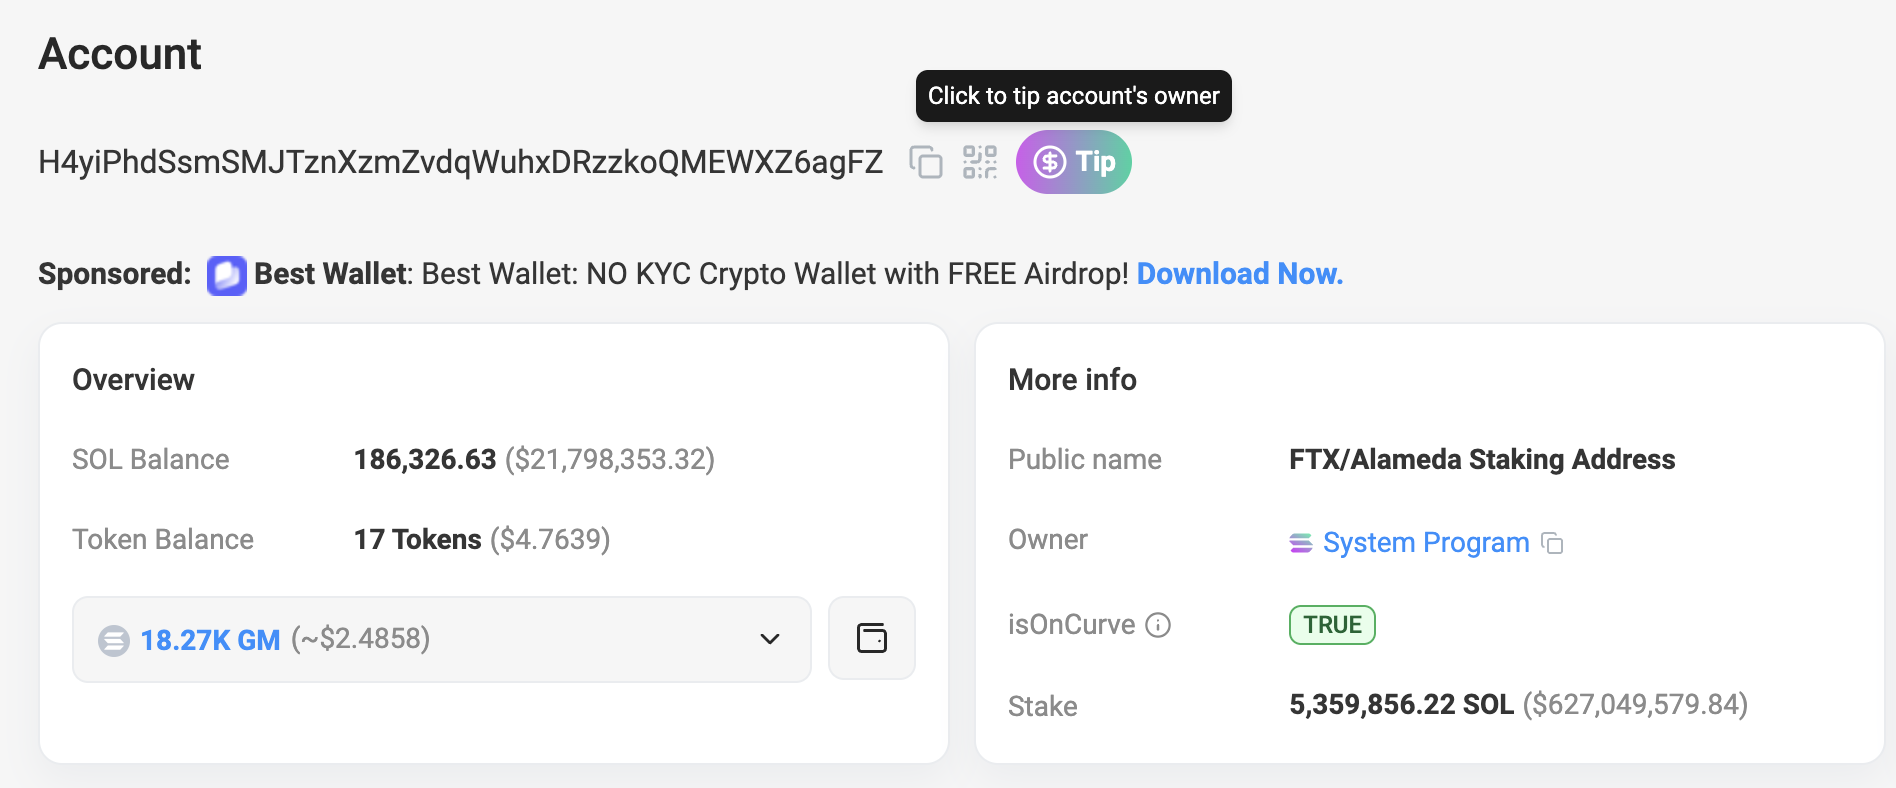
FTX unstaked SOL | Source | Solscan
Solana price did not immediately react to the news; however, volatility may spike depending on the action after the unstaking.
Meanwhile, as observed in the daily chart below, a neutral technical structure highlights the need for Solana to break the 3-month descending trendline from January to reinforce a new bullish outlook.
Although neutral at 44.73, the Relative Strength Index (RSI) indicator has recovered from Monday’s sharp drop to 32.99, triggered by a widespread spike in volatility. Investors anticipated the impact of President Trump’s tariffs, which came into effect on Wednesday but were suspended for 90 days later that same day.
Based on the RSI’s movement since Wednesday, Solana leans bullish while awaiting a breakout from the trendline resistance in the daily chart. If resistance at $120.00 flips into support, more traders may consider additional exposure.
Since Solana is below the 50-day Exponential Moving Average (EMA) at $137.14, the 100-day EMA at $156.66 and the 200-day EMA at $166.61, it could be challenging to sustain the uptrend in the short to mid-term, as all these EMAs may act as key resistance areas.
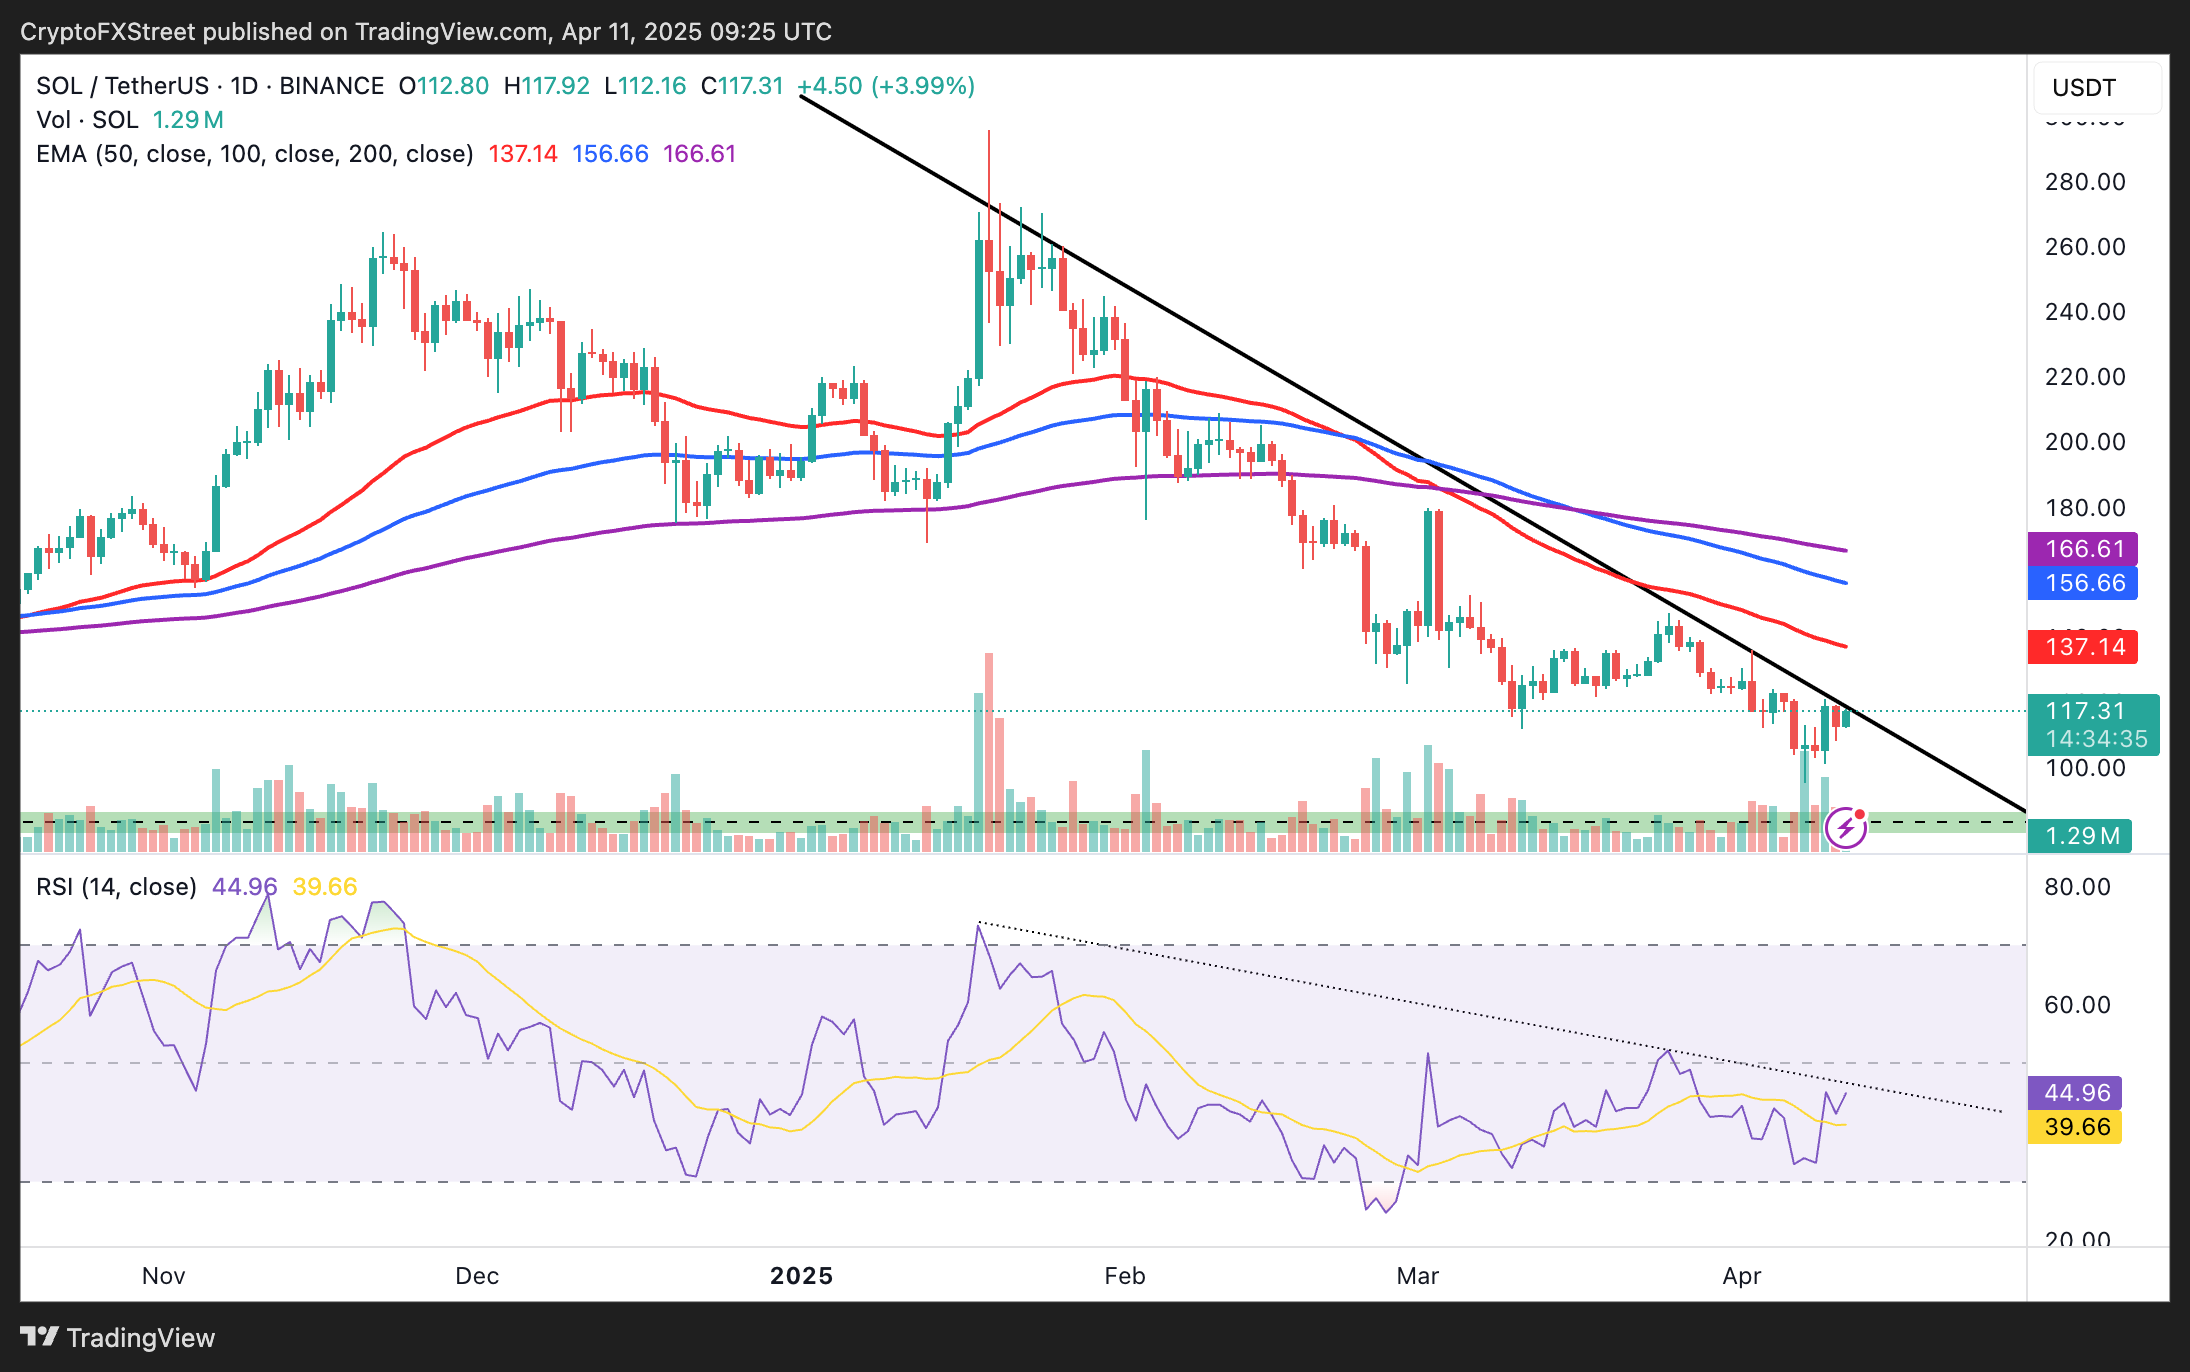
SOL/USD daily chart
Coinglass’s derivatives data shows a slightly positive long/short ratio, implying increasing bets on a Solana price increase. In the last four hours, $1.13 million in short positions has been liquidated compared to $176,190 in long positions. Similarly, a 2.66% increase in open interest to $4.28 billion suggests more capital inflow.
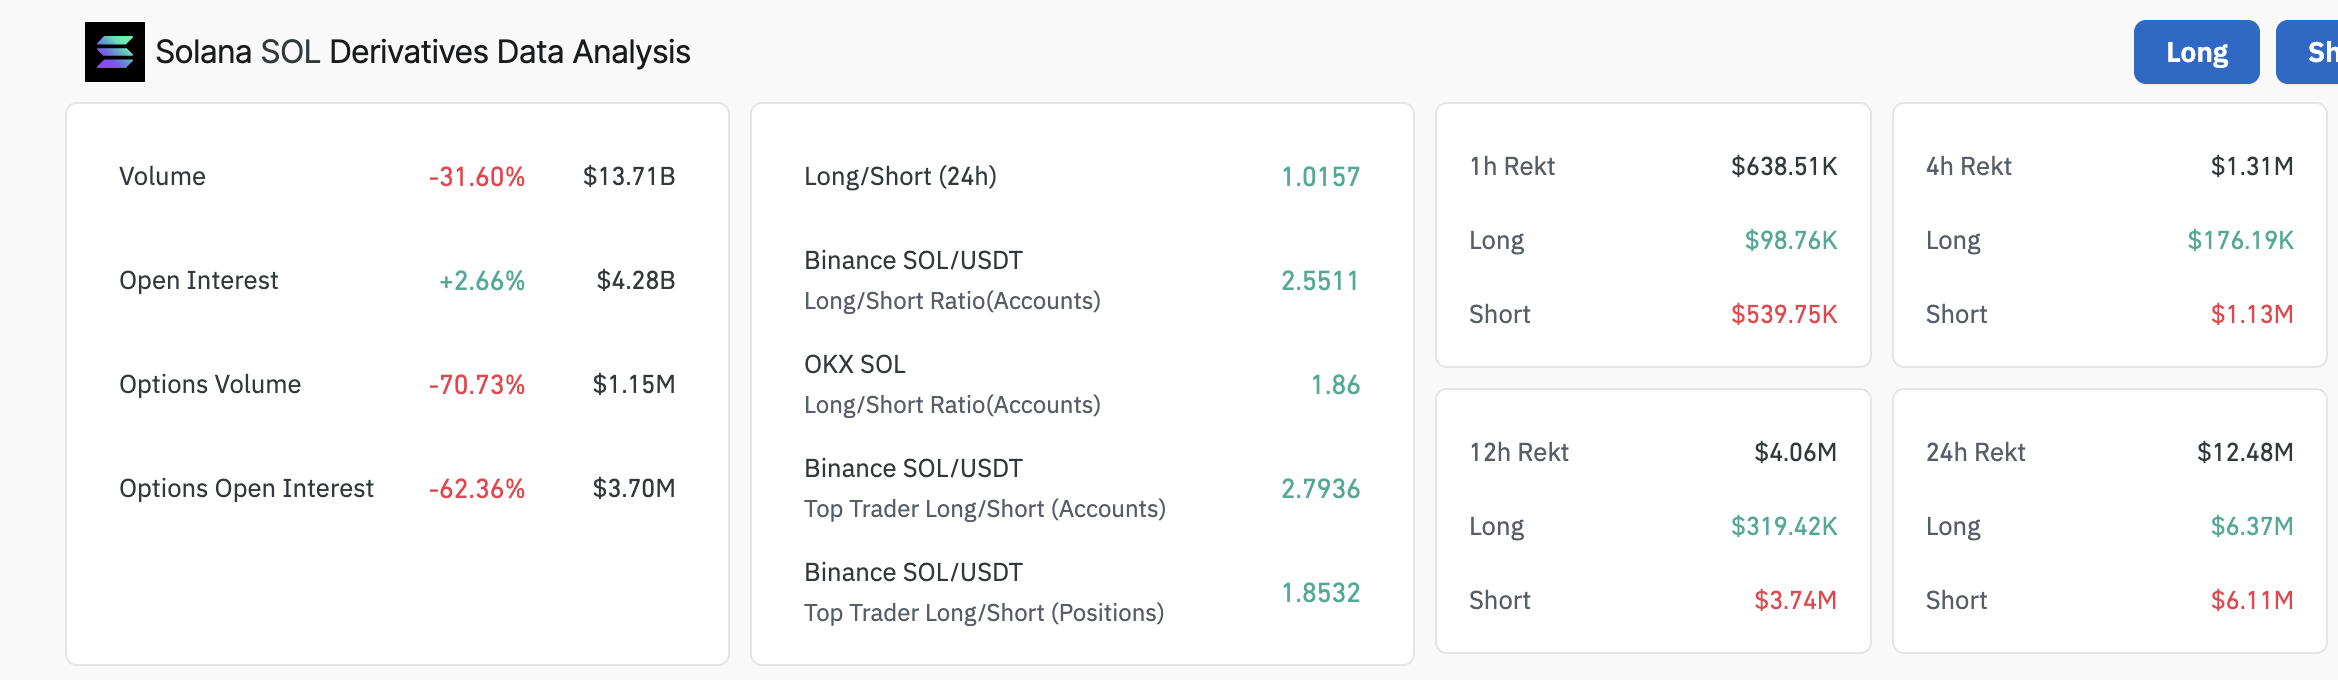
Solana derivatives analysis data | Source: Coinglass
Global markets, including crypto, dumped on Monday and Tuesday but started to recover during the US session on Wednesday, signaling an improving macroeconomic environment as President Trump paused tariffs.
It is unclear whether this uptrend will continue, which calls for vigilance, considering the US and China are still escalating the trade war. Therefore, it may be too early to rule out the possibility of Solana price retesting Monday’s $100 support until the breakout reclaims the 50-day EMA and the 100-day EMA as support levels.
Recommended Articles


