


Top 3 Crypto Gainers Today: SUI,TONCOIN, Pi Network Price Predictions
- SUI, Toncoin, and PI Network have emerged as top gainers among the top 20 ranked crypto assets on Thursday.
- TON price rally comes after Elon Musk confirmed Grok AI integration into Telegram.
- PI Network price rallies 6% amid intense community activity around the recent network migration.
- SUI price rally has been linked to Canary Capital’s recent ETF filing with the US SEC.
SUI, Toncoin (TON), and Pi Network (PI) have emerged as the top-performing assets among the top 20 ranked cryptocurrencies on Thursday. These altcoins saw impressive gains driven by fundamental developments, institutional interest, and growing community activity. Here’s an in-depth analysis of potential price outlook for each token.
TONCOIN price gains 10% on Grok AI and Telegram partnership
Toncoin (TON) price rose 10% on Thursday to emerge as the top performer.
The TON price surge follows news that Elon Musk’s Grok AI would be integrated into Telegram, the popular messaging platform that supports the TON blockchain.
TON Price Forecast: Breakout or rejection at $4 resistance?
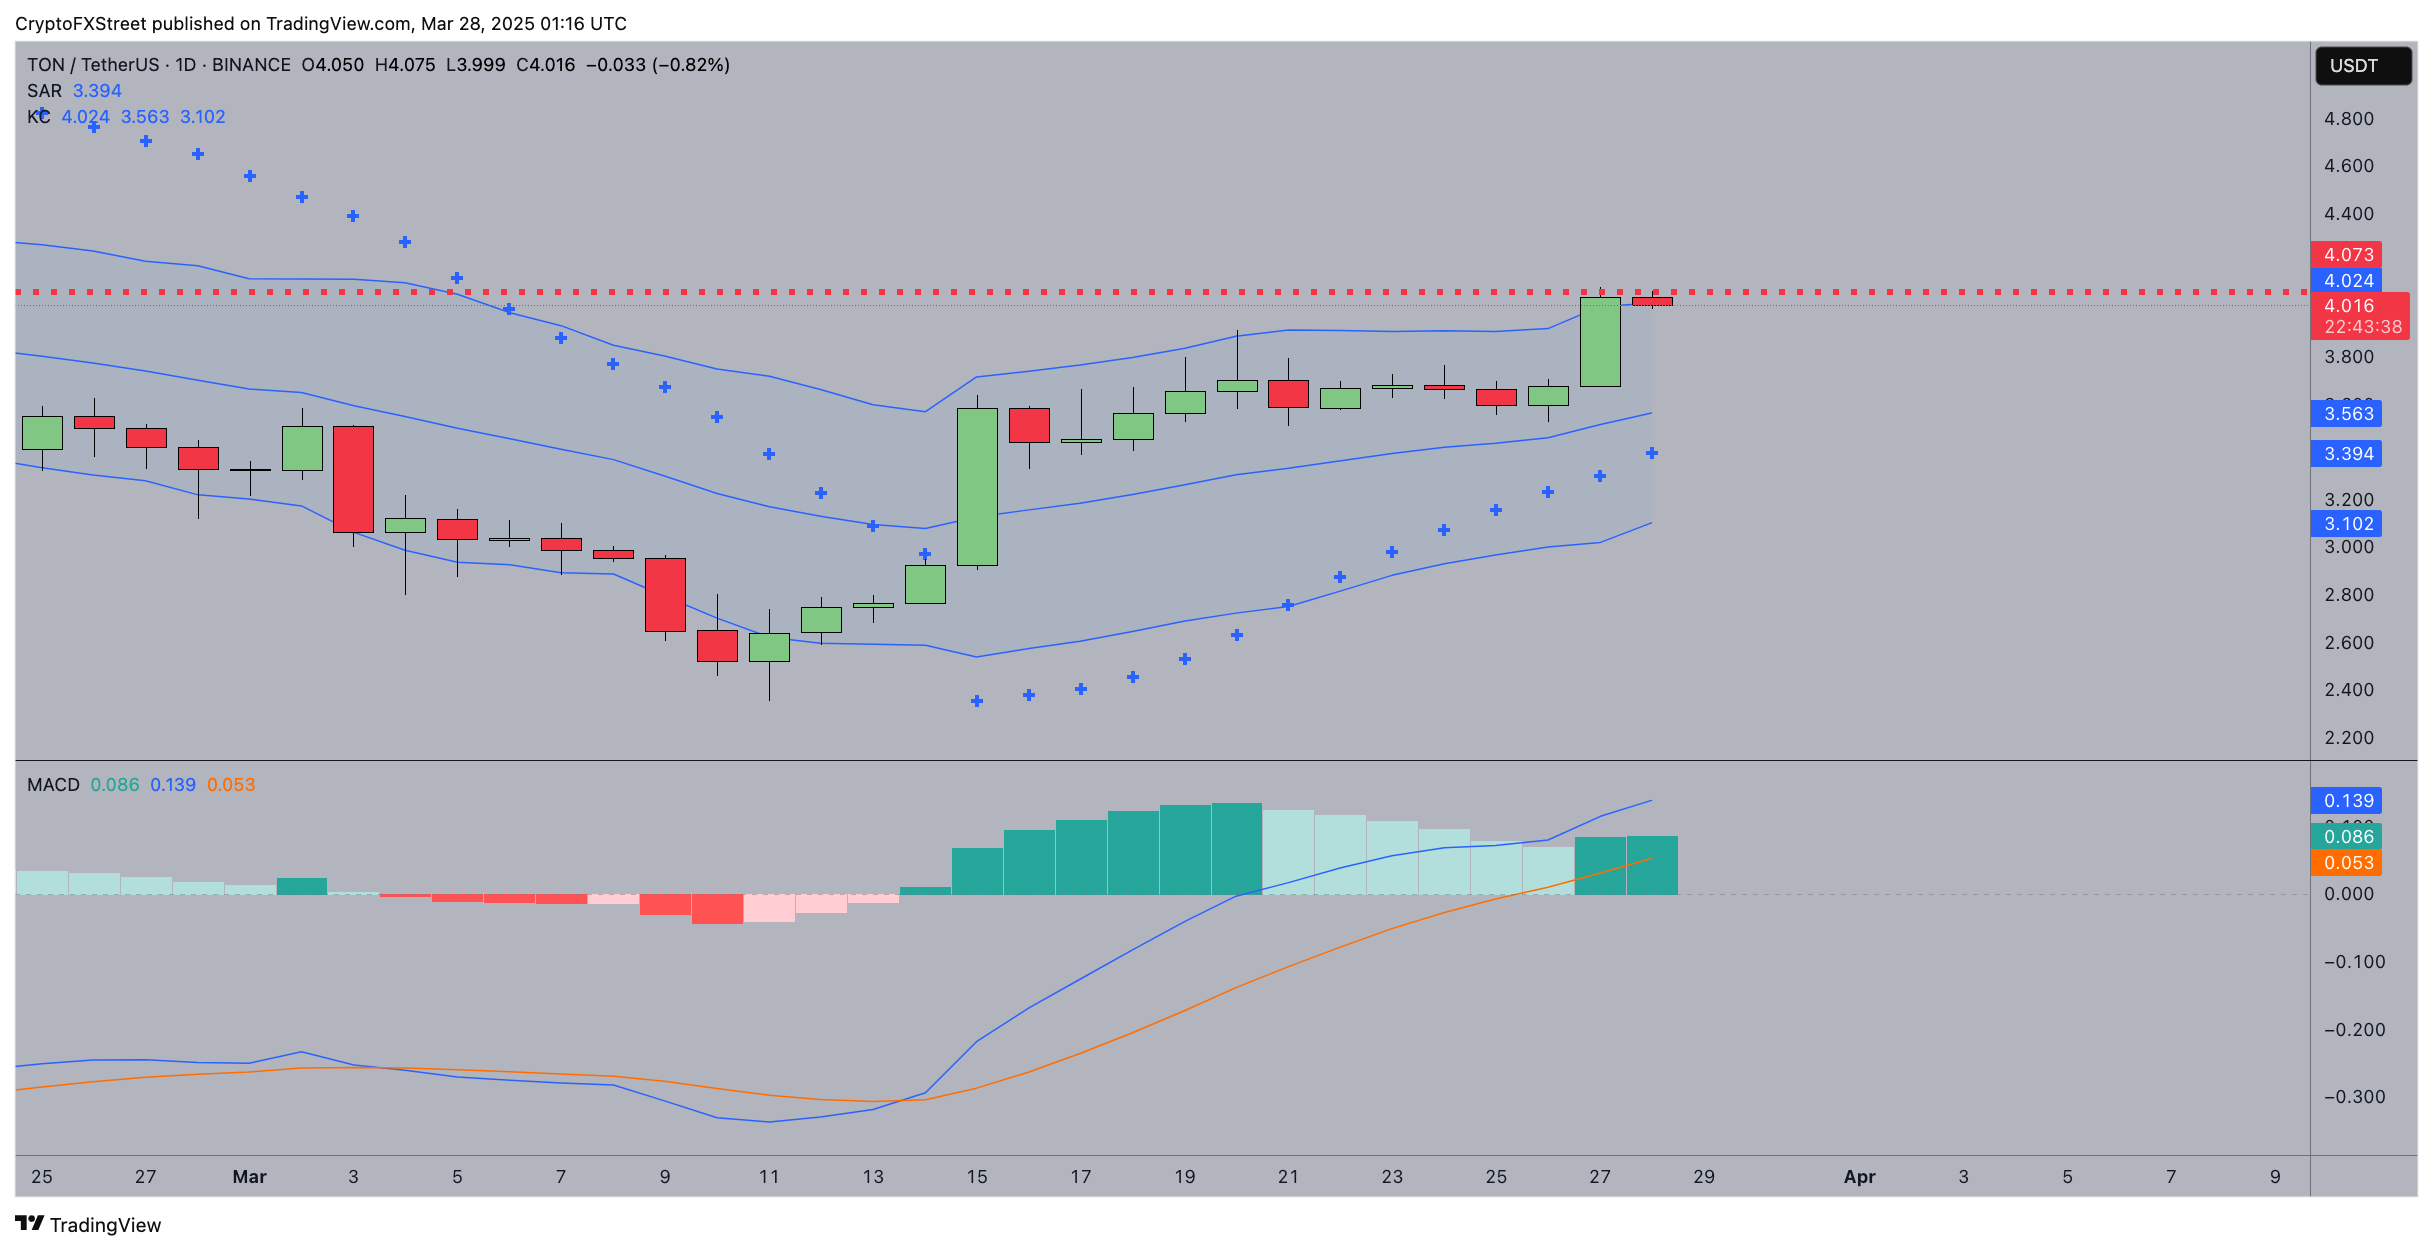
TON price forecast signals a crucial moment as the token tests resistance at $4.02, following a strong rally fueled by Grok AI’s integration into Telegram.
As seen below, TON price has surged from support near $3.10 and is now challenging a significant supply zone.
The Parabolic SAR at $3.39 remains bullish, reinforcing the uptrend. The Keltner Channel upper band at $4.02 marks a decisive point—breaking above it could send TON toward $4.40, while rejection may trigger a retracement.
TON Price Forecast
The MACD remains in bullish territory, with the MACD line above the signal line at 0.139, confirming positive momentum.
However, the histogram shows weakening bullish strength, suggesting buyers may be losing steam.
If TON fails to hold above $4.02, a pullback toward $3.56 or even $3.39 could be on the cards.
For now, the bullish case hinges on a daily close above $4.02, which could accelerate gains.
However, a rejection at this level may lead to profit-taking, exposing lower supports. Traders should watch volume and momentum indicators for confirmation of the next major move.
Pi Network gains 6% as community activity intensifies
Pi Network (PI) posted a 6% price increase on Thursday, driven by growing activity within its community following the network’s recent migration on March 21.
The transition has sparked renewed confidence among investors and early adopters, leading to an uptick in on-chain transactions and network participation.
Pi Network Price Forecast: Bearish momentum persists despite recent gains
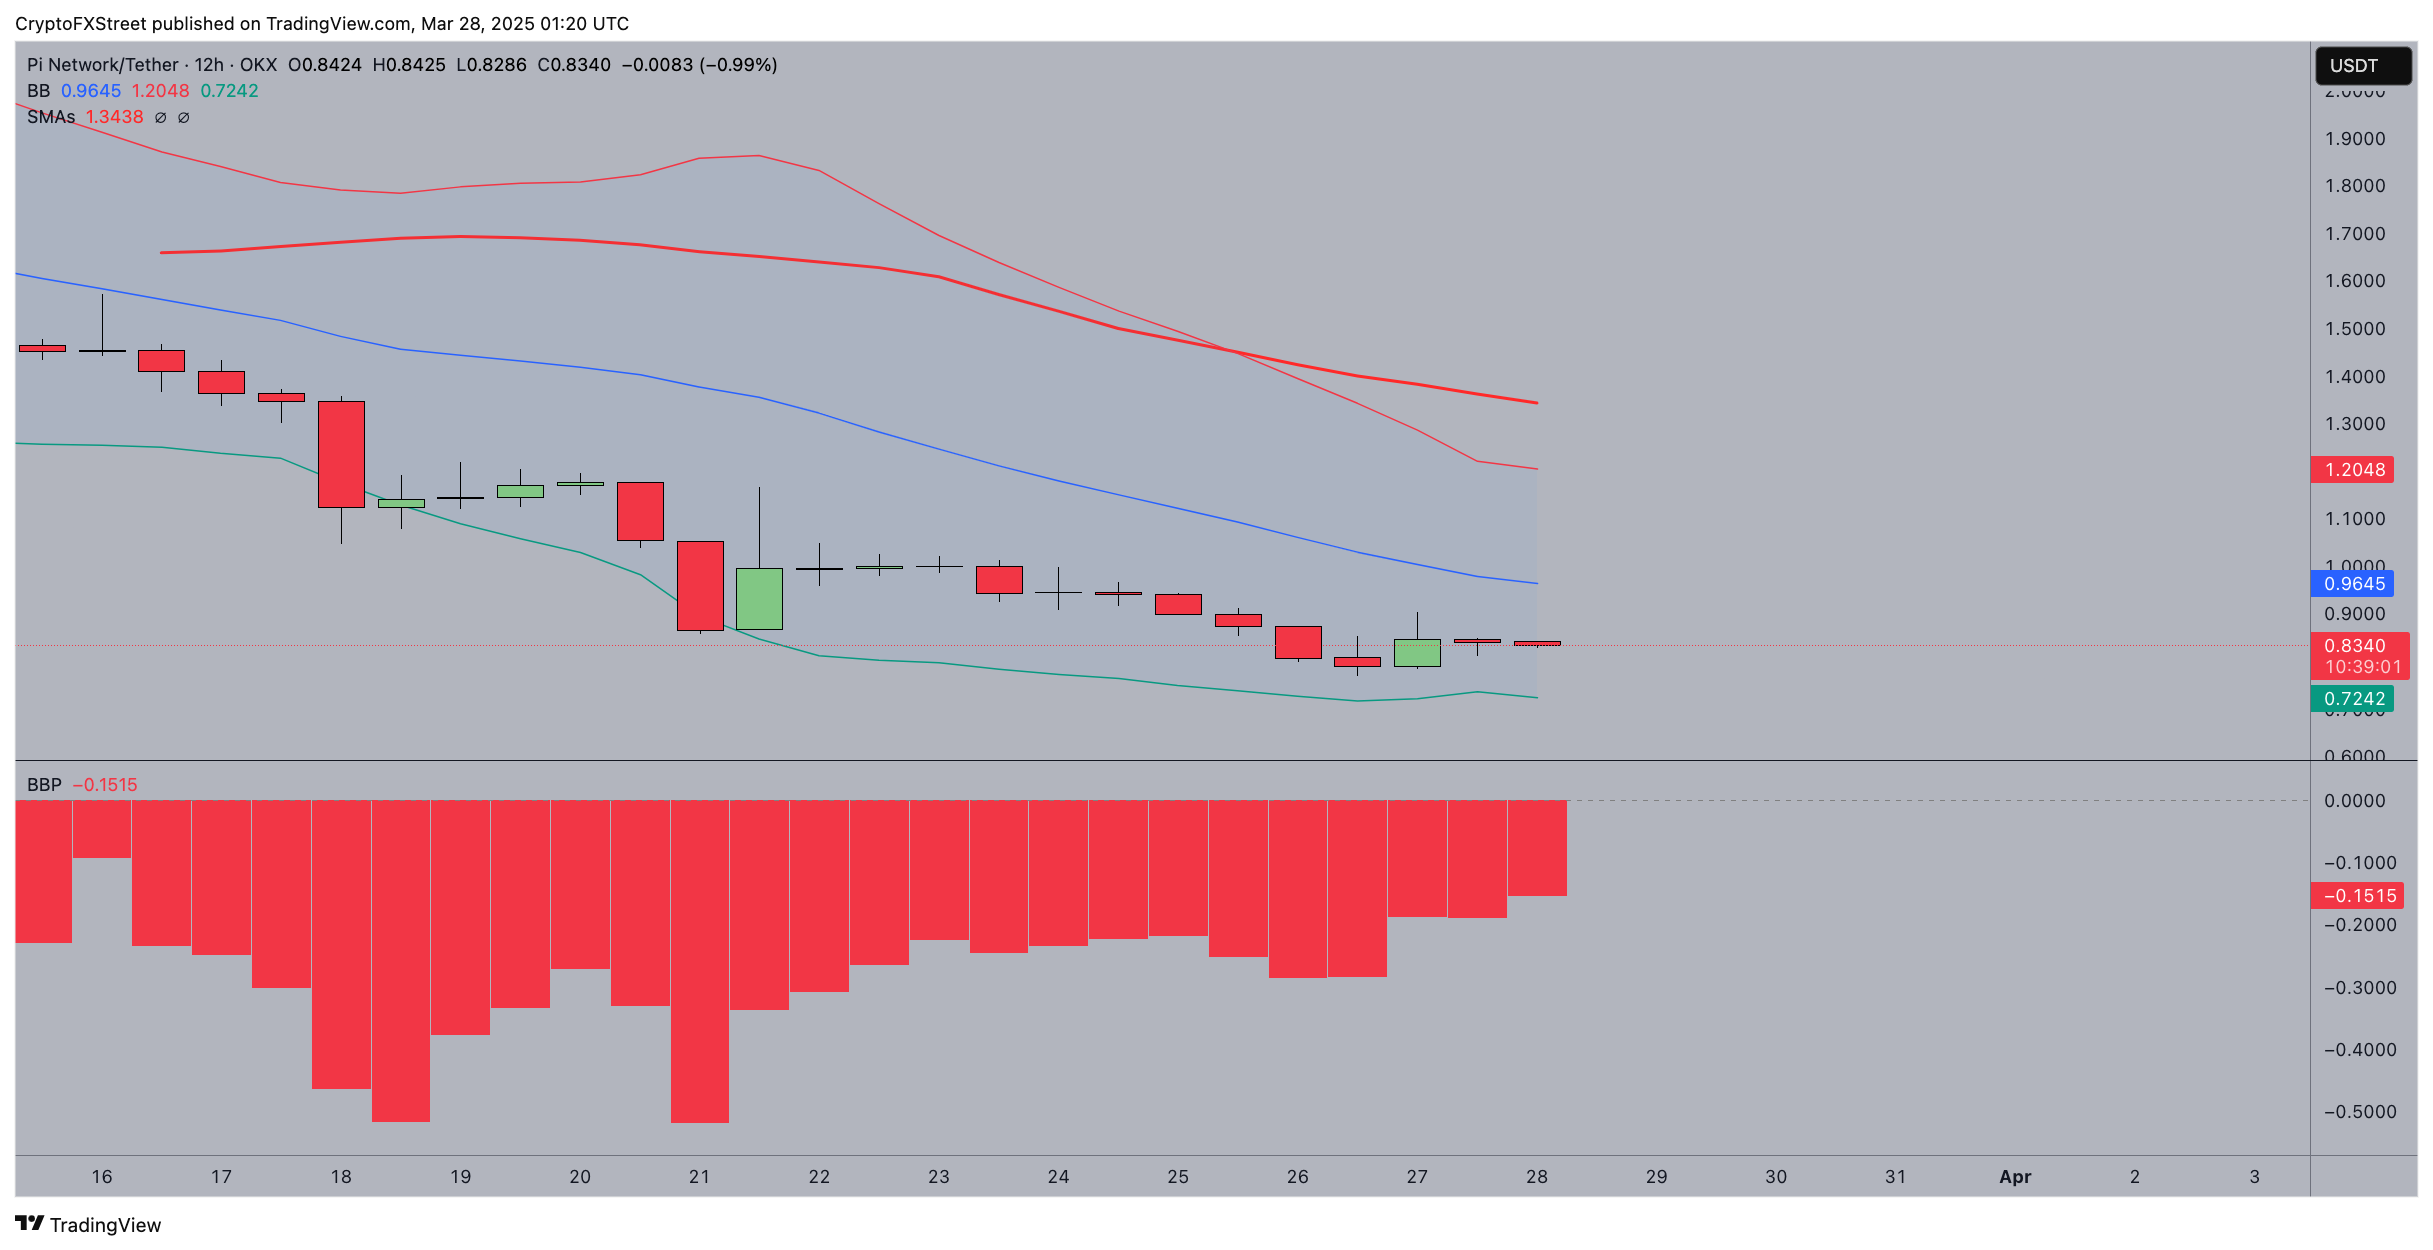
Pi Network’s price forecast suggests that despite a 6% uptick, the overall trend remains bearish as PI struggles below key resistance levels.
The Bollinger Bands indicate that the price is hovering near the lower band at $0.7239, signaling oversold conditions.
However, the middle band at $0.96 acts as a resistance point, which bulls must reclaim for sustained upside momentum.
 Pi Network Price Forecast
The Bearish Bollinger Percentage (BBP) at -0.1510 confirms that downward pressure is still strong, reflecting weak buyer interest.
The Simple Moving Average (SMA) at $1.20 remains far above the current price, underscoring the long-term downtrend.
If Pi Network fails to reclaim the $0.90 psychological level, further declines toward $0.72 or even $0.65 remain possible.
For a bullish reversal, PI needs a daily close above the middle Bollinger Band and an improvement in momentum indicators.
SUI Price rallies 6% fueled by Canary Capital’s ETF filing
SUI, the native token of the Sui blockchain, has also emerged as a top gainer after Canary Capital filed for an SUI ETF with the U.S. Securities and Exchange Commission (SEC).
This development has fueled institutional interest, leading to a strong uptick in trading volume and price action.
SUI Price Forecast: $3 rejection ahead if ETF hype subsides
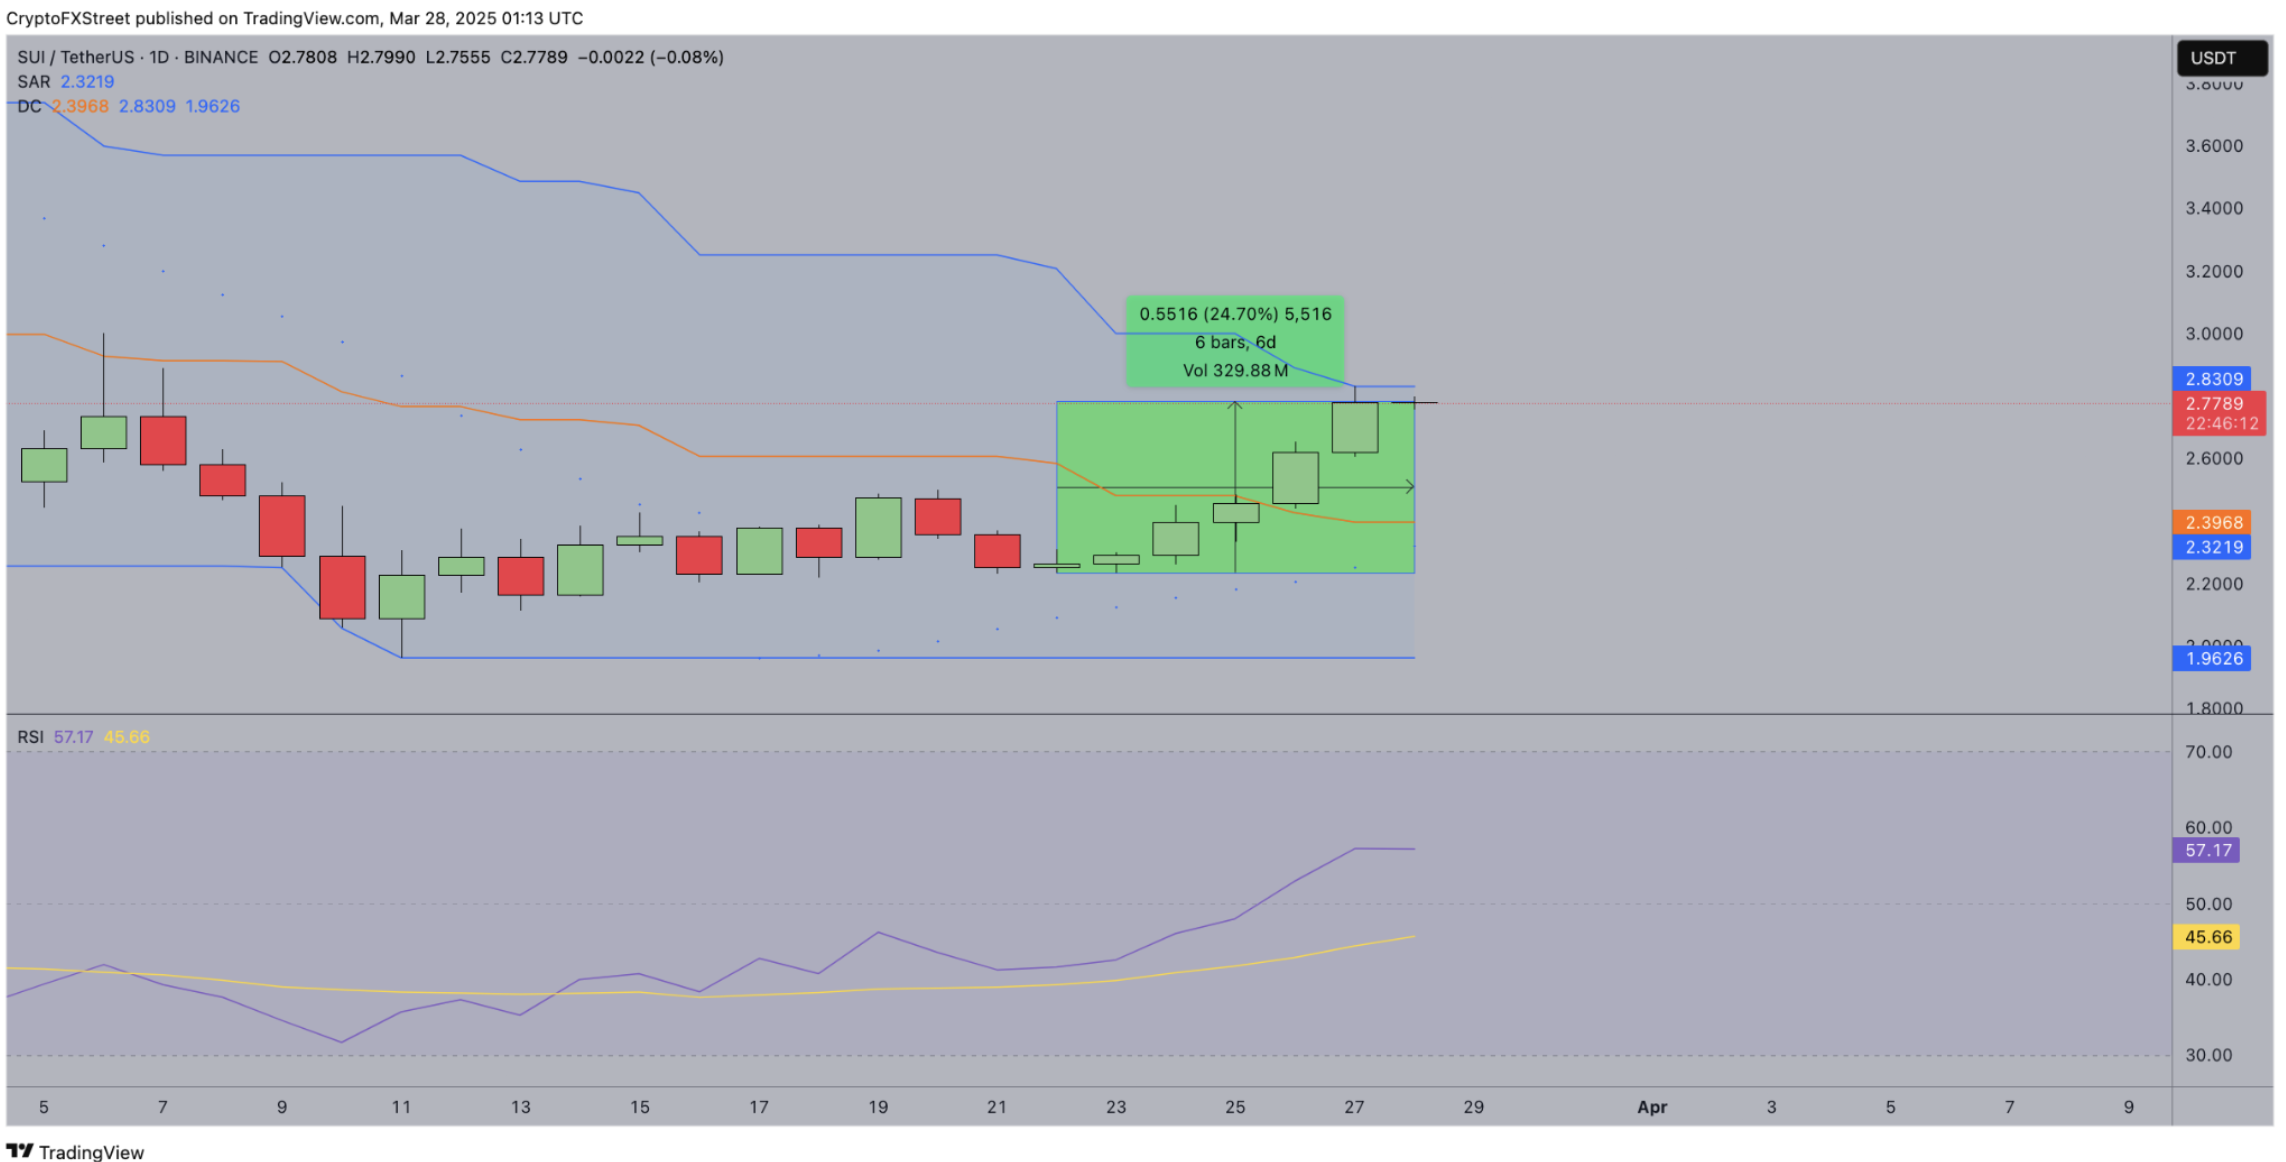
SUI price forecast suggests a bullish continuation as institutional interest drives momentum, with price breaking above $2.40 and nearing $2.83 resistance.
The token has surged 24.7% in six days, supported by strong trading volume.
The Donchian Channel (DC) upper band at $2.83 signals a critical resistance level.
If SUI clears this level, it could extend gains toward $3.00. The Parabolic SAR at $2.32 remains below the price, confirming bullish control.
SUI Price Forecast
However, the Relative Strength Index (RSI) at 57.17 suggests moderate momentum, but a downturn could indicate weakening buying pressure.
If rejection occurs at $2.83, SUI may retest support at $2.40, marked by the DC mid-line.
A breakdown below this level would expose the lower band at $1.96, signaling a deeper correction.
For now, institutional demand and ETF speculation support the uptrend, but the next move hinges on whether SUI breaks resistance or faces profit-taking.
A decisive close above $2.83 validates further gains, while failure to do so could trigger a pullback toward key support levels.
As the market reacts to these developments, traders and investors will be watching whether SUI, TON, and PI can sustain their upward momentum in the coming days.
If broader market conditions remain favorable, these assets could see further gains, solidifying their status as top-performing cryptocurrencies of the week.
Recommended Articles


