

Dogecoin Price Forecast: Will Bitwise ETF filing drive DOGE to $1?
- Dogecoin price declined 5% on Thursday, hitting the $0.35 level as bullish catalysts triggered a sell-the-news frenzy.
- Digital asset manager firm Bitwise filed a DOGE spot ETF with the US SEC.
- Bull traders have mounted $55 million around the $0.33 level, signaling prospects of an early rebound.
Dogecoin price declined 5% on Wednesday, trading as low as $0.35 on Binance. Recent movements signal a sell-the-news frenzy after a cluster of bullish catalysts emerged within the DOGE markets this week. Can bull traders hold out for an early DOGE price rebound?
Dogecoin tumbles 5% as Trump and Bitwise ETF spark sell-the-news frenzy
Dogecoin’s price experienced sharp downward volatility on Thursday, driven by a sell-the-news frenzy despite a series of positive events.
On Tuesday, United States (US) President Donald Trump signed the "Department of Government Efficiency" bill into law, with the official website notably featuring a Dogecoin logo.
The connection to Dogecoin drew positive sentiment from the market due to Elon Musk's long-standing support for the cryptocurrency.
On Wednesday, asset management firm Bitwise filed a spot Dogecoin ETF application with the US Securities and Exchange Commission (SEC).
This cluster of bullish developments, however, appears to have prompted profit-taking among Dogecoin holders.
Many investors who started buying DOGE during Musk’s public alignment with Trump’s campaigns in September 2024 are now sitting on over 200% unrealized gains.
With Dogecoin hitting notable milestones, these holders opted to lock in profits. As a result, Dogecoin’s price plunged 5% in the last 24 hours, reaching $0.35 by Thursday.
This sharp decline came despite the dual tailwinds of Trump’s endorsement and Bitwise’s ETF filing.
Based on recent DOGE price movements, the majority of Dogecoin holders opted to book profits, as Dogecoin attained two major feats.
The chart above shows how the price plunged 5% in the last 24 hours, to hit the $0.35 level on Thursday, despite multiple bullish news events.
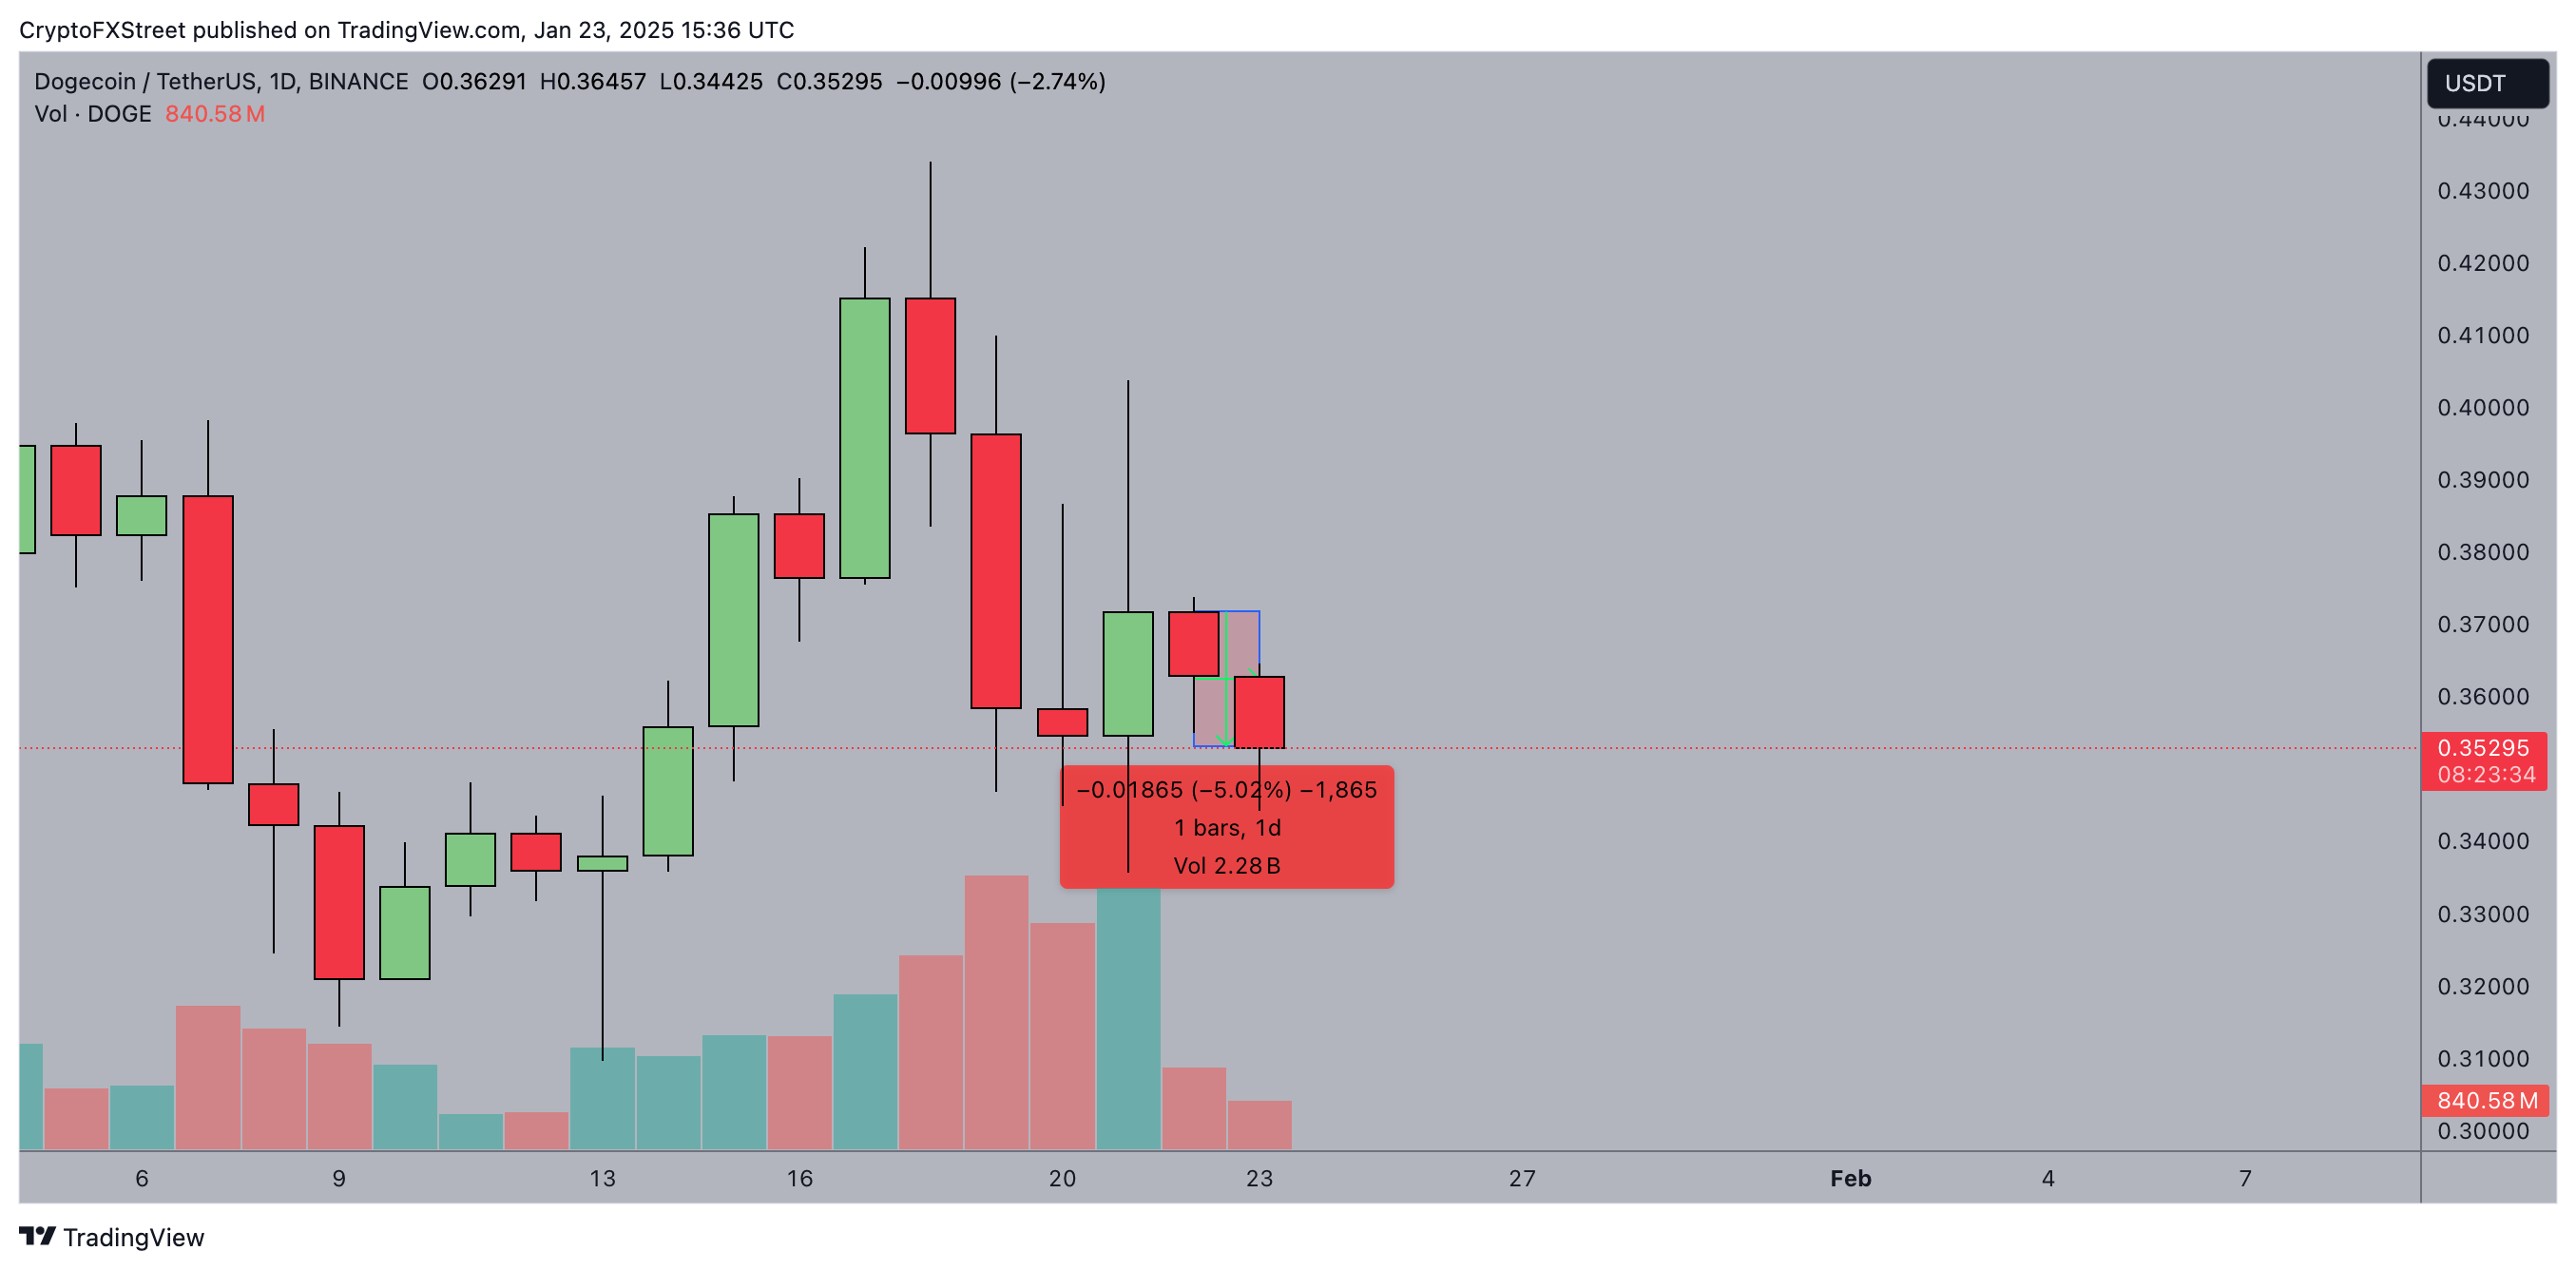 Dogecoin Price Action, January 23, 2025 | Source: TradingView
When an asset's price declines sharply after positive events, as observed in the Dogecoin market this week, it signals a class sell-the-news cycle.
However, considering that such sell-offs often do not indicate a deterioration in any key fundamental factors, traders booking profits on Dogecoin this week could begin to seek buy-in opportunities at these lower prices.
This could potentially spark a Dogecoin price rebound in the days ahead.
Bull traders deployed $55M leverage to prevent a $0.33 breach
Dogecoin’s 5% price dip, coinciding with positive market developments, reflects a widespread profit-taking trend.
However, Bitwise’s ETF application underscores Dogecoin’s long-term bullish prospects as it attracts fresh institutional-sized capital inflows.
In response, strategic speculative traders are taking resilient positions, anticipating an early rebound in Dogecoin’s price.
Confirming this outlook, the Coinglass Liquidation Map chart below highlights the total value of leveraged long and short futures contract positions clustered around the current price levels.
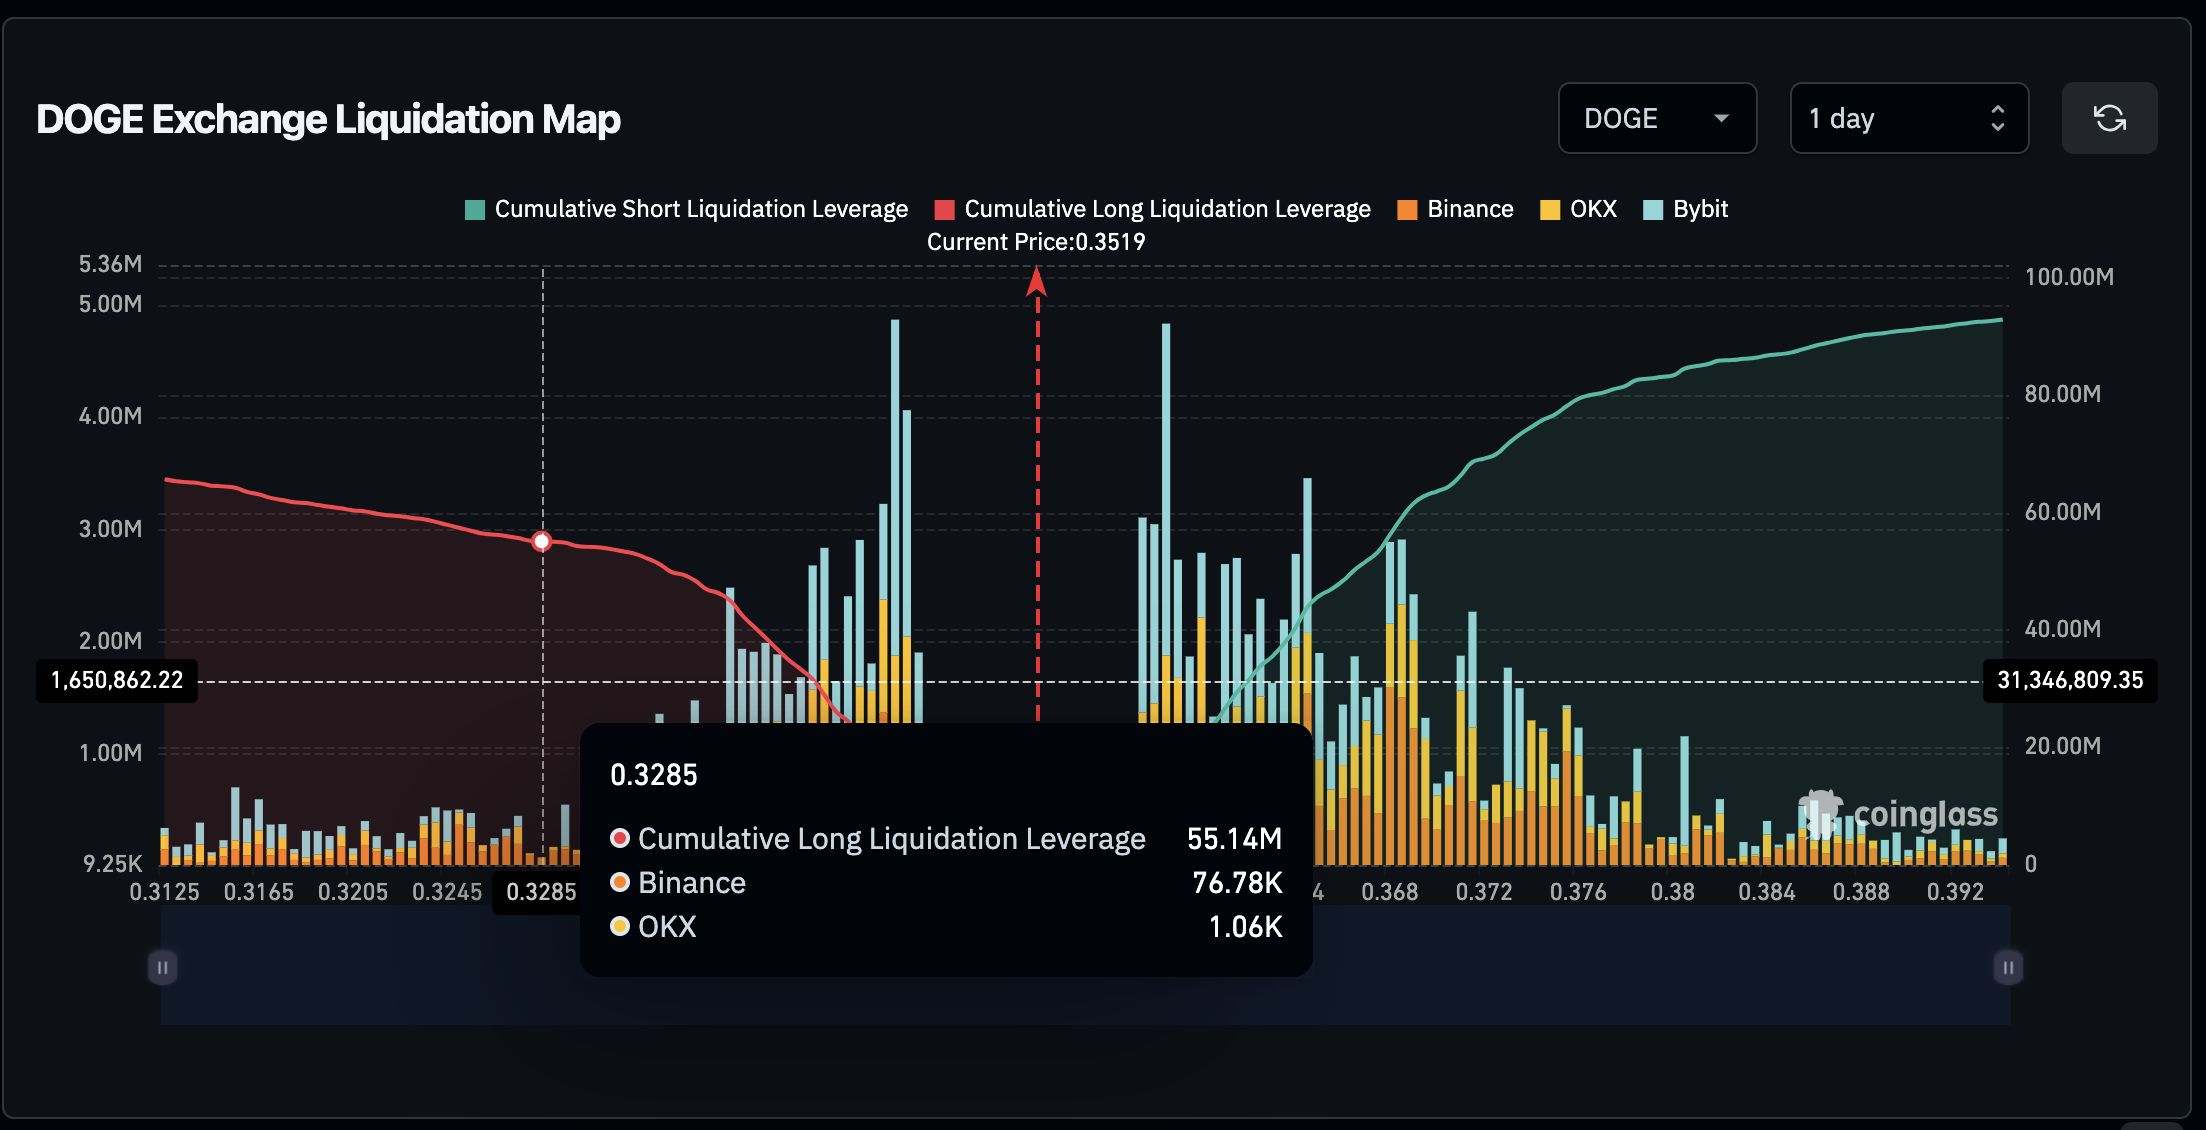 Dogecoin Liquidation Map, January 23, 2025 | Source: Coinglass
At first glance, bearish sentiment dominates the Dogecoin derivatives market, with active short positions totaling $92 million, significantly outpacing the $65 million in active long positions.
While this imbalance signals strong bearish dominance, a closer analysis reveals that over 80% of the total active DOGE short positions are concentrated around the $0.33 price level.
This indicates that bullish traders could face liquidations totaling $55 million if Dogecoin’s price falls below $0.33.
To prevent these losses, traders holding those positions may be compelled to initiate covering spot purchases, which could trigger an early price rebound, particularly if the ongoing sell-offs ease as the initial euphoria surrounding recent news events tapers off.
Dogecoin price forecast: Bulls regrouping at $0.33 for early rebound
Dogecoin price is trading at $0.3505, with the daily chart suggesting the possibility of a rebound as buyers move to defend the critical $0.33 support level.
The Bollinger Bands are narrowing, signaling reduced volatility and a consolidation phase that often precedes sharp directional moves. DOGE’s price is testing the lower band at $0.35, indicating oversold conditions and potential for upward momentum if buyers regain control.
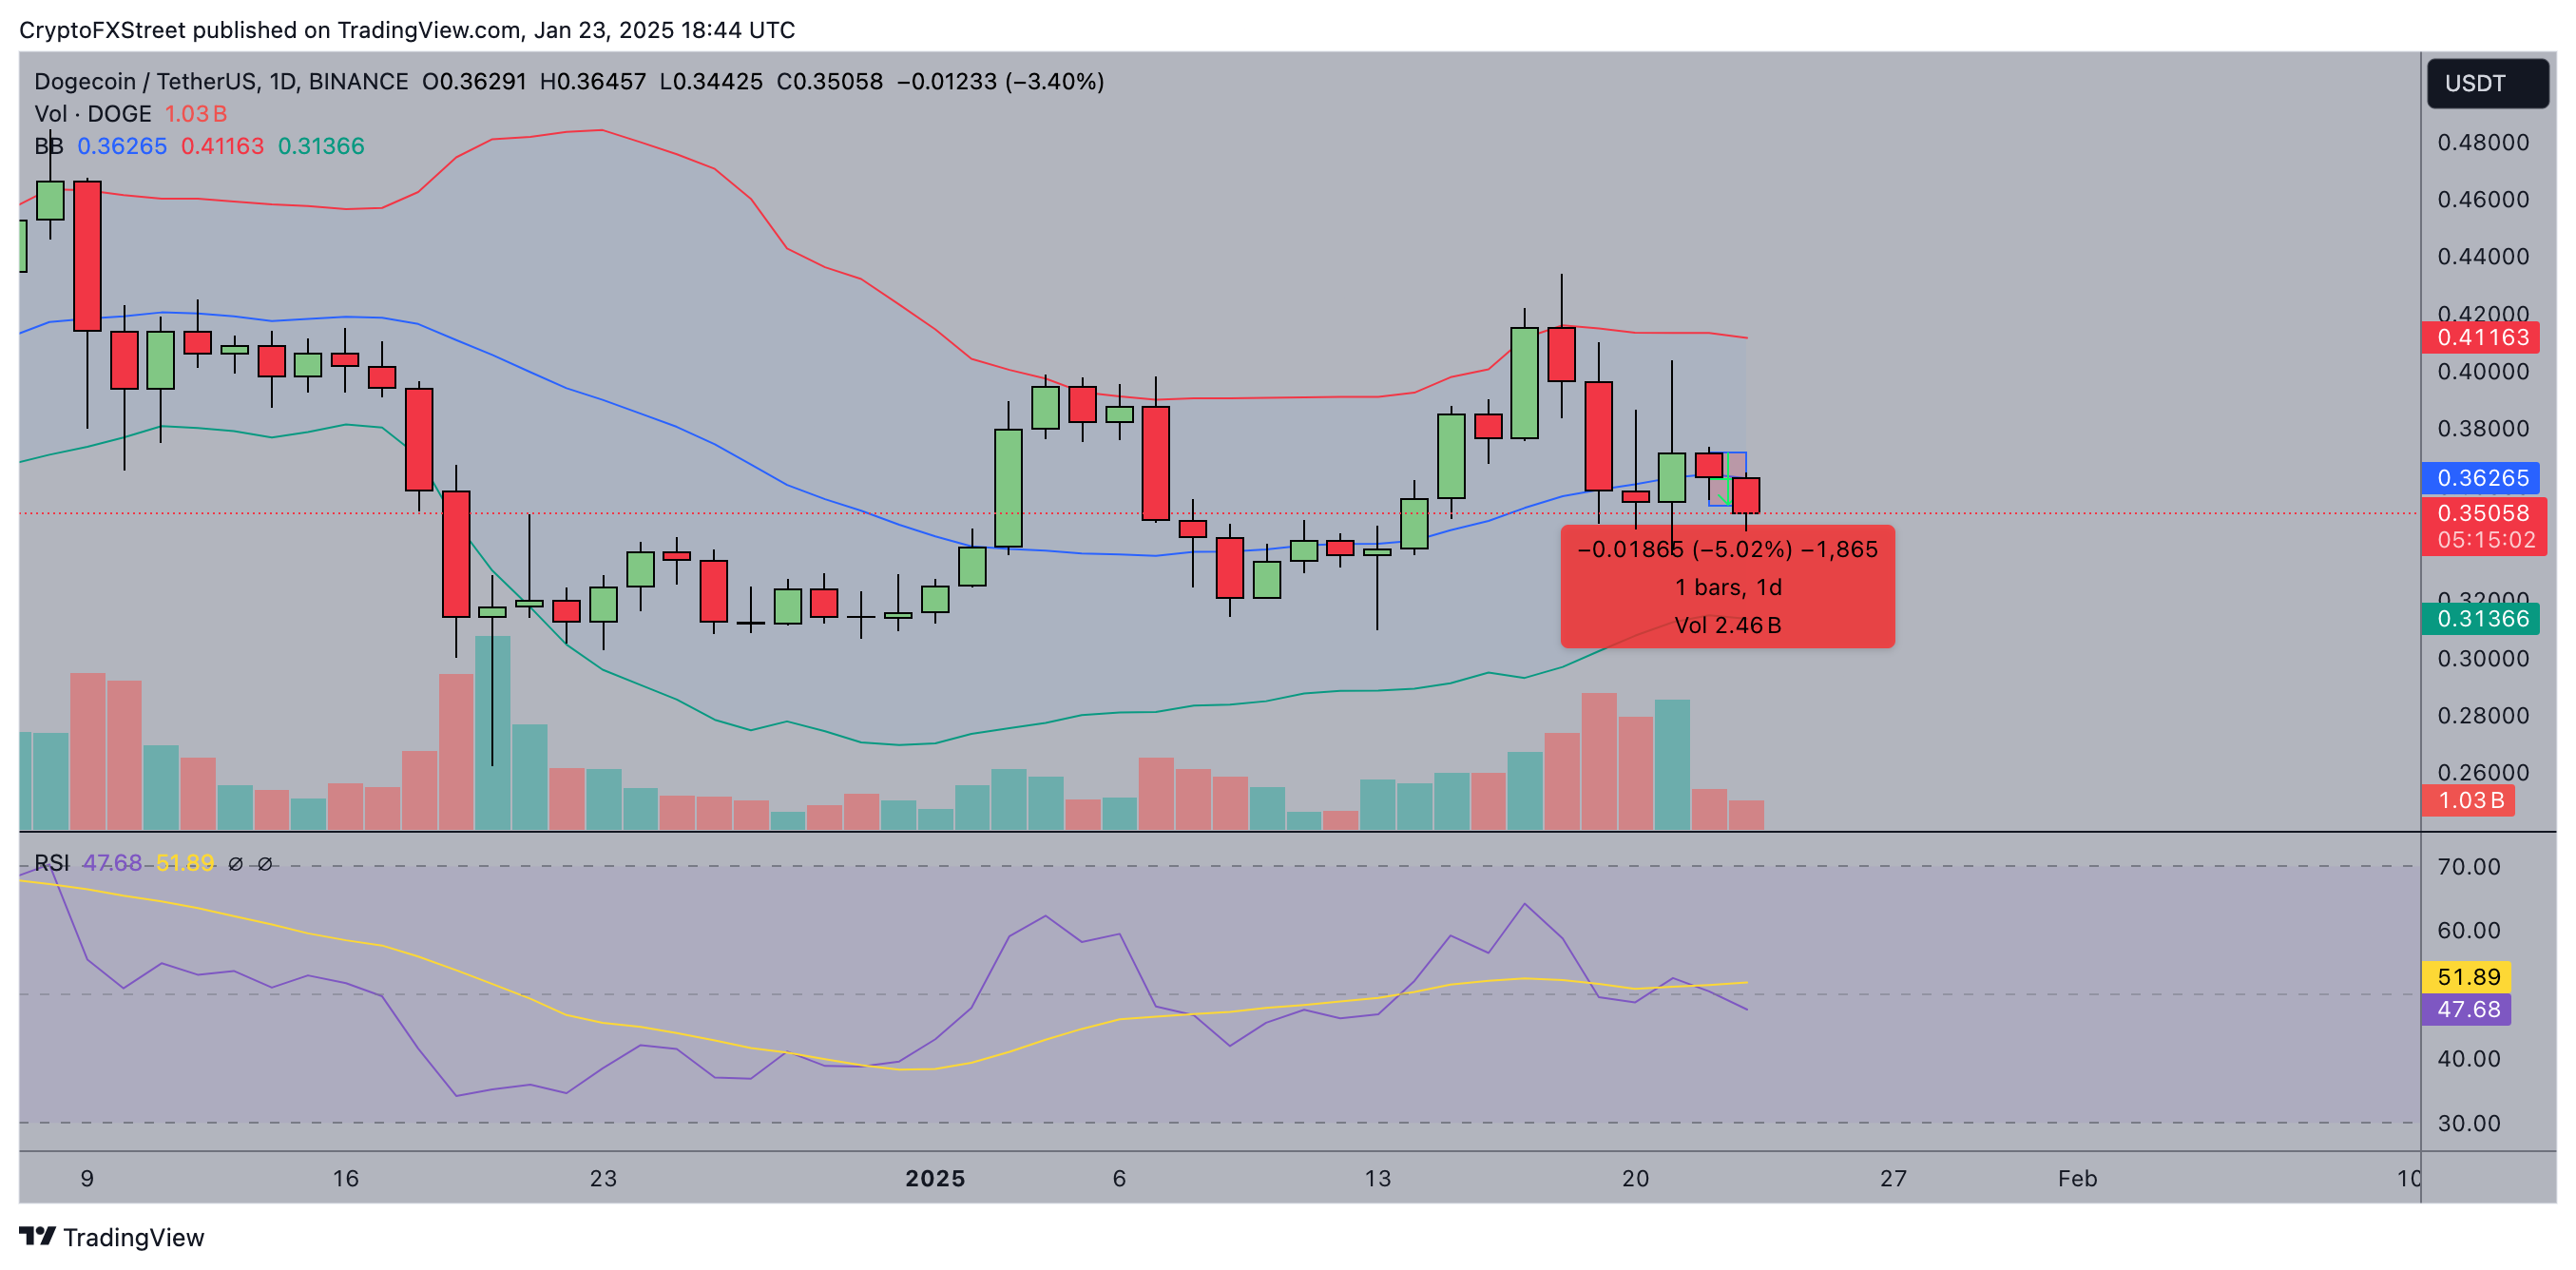 Dogecoin Price Forecast | DOGEUSD
The RSI at 47.68 is approaching neutral territory but remains below its signal line, highlighting waning bearish strength.
For a bullish scenario, DOGE must decisively reclaim the midline of the Bollinger Bands at $0.362, which could trigger a rally toward $0.41, the upper band.
Renewed buying interest would be supported by increased volume, which has remained subdued.
Conversely, a bearish breakdown below $0.33 could expose DOGE to further losses, targeting $0.31 and $0.28.
Traders should monitor volume spikes and RSI movement, as divergence could signal the next directional trend.
Amid the ongoing consolidation, the Dogecoin’s technical price outlook leans cautiously bullish with critical resistance at $0.41 and the $0.33 support level dictating the near-term trend.
Recommended Articles


