

Arbitrum price shows signs of exhaustion even as ARB TVL records new seven-month high
- Arbitrum price has recorded a massive recovery, governed by a rounding bottom pattern.
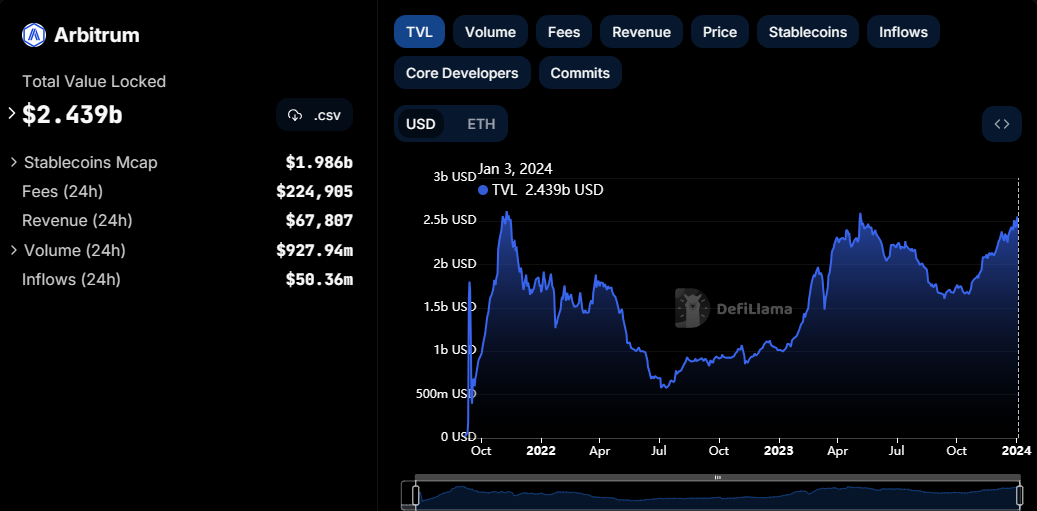
- The move has seen ARB TVL record a seven-month high at $2.439 billion, suggesting growing interest in the L2 token.
- However, with the ADX beginning to slope and the RSI at 81, the altcoin could top out soon amid buyer exhaustion.
- A break and close above the $2.200 psychological level would invalidate the bearish thesis.
Arbitrum (ARB) stands among the top performers in the market on Wednesday, sidestepping the broader market crash led by Bitcoin (BTC) price to pump hard. The Ethereum-based Layer 2 (L2) token has shown strength, distancing itself from panic selling amid rumors that the US Securities and Exchange Commission (SEC) would reject spot BTC exchange-traded funds (ETFs) in January.
Also Read: Bitcoin open interest hits $19 billion as Jim Cramer declares BTC ‘indestructible’
Arbitrum TVL hits seven-month high
Arbitrum (ARB) price surged 10% during the early hours of the New York trading session, with a 130% rise in trading volume. This points to increasing investors’ attention and interest in ARB tokens. The Total Value Locked (TVL) of Arbitrum recording a seven-month high of $2.439 billion accentuates this outlook. A rise in TVL points to increasing liquidity in the protocol, growing popularity, and usability.
ARB TVL
Nevertheless, Arbitrum price shows signs of topping out soon as the technicals hint at a possible exhaustion after a 160% surge beginning in October 2023.
Arbitrum price likely to top out soon
After a 160% recovery, Arbitrum price shows signs of exhaustion even as the price action has been governed by a rounding bottom pattern. This technical formation, found at the end of extended downward trends, follows a series of price movements that graphically form the “U” shape. It signifies a reversal in a long-term price movement.
The position of the Relative Strength Index (RSI) at 81 shows that ARB is already massively overbought, suggesting a possible pullback. The outlook of this momentum indicator, coupled with the hinted deviation of the Average Directional Index (ADX) indicator at 35, shows that the bulls are approaching an exhaustion point.
In this regard, a daily candlestick close below the immediate support at $1.8225 could provoke profit booking, likely sending Arbitrum price to the $1.4676 level. In the dire case, the slump could see the L2 token find support around $1.4000 or lower at the $1.2000 psychological level.
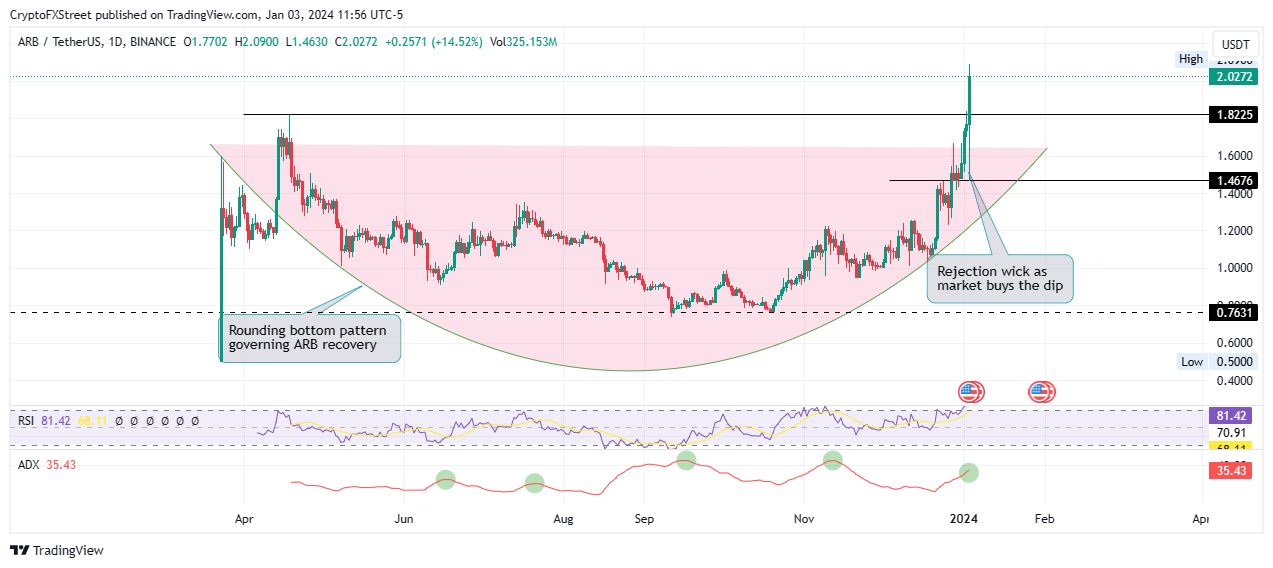
ARB/USDT 1-day chart
On-chain metrics: GIOM
Based on data from IntoTheBlock’s Global In/Out of the Money (GIOM) metric, if Arbitrum price drops, it could find support between the $1.3500 and $1.6400 range, where approximately 131,720 addresses currently hold 2.77 billion ARB tokens purchased at an average price of $1.43. This area coincides with where traders bought the dip.
Conversely, after a bullish rejection from the lower wick following a stark crash, it appears the bulls stand in readiness to buy any correction. The ensuing buyer momentum could see Arbitrum price extend north, reclaiming the $2.0272 range high before a possible neck higher to the $2.2000 psychological level. A daily candlestick close above this level would invalidate the bearish postulation, setting the pace for a move to the $2.4000 psychological level. Such a move would constitute a 20% climb above current levels.
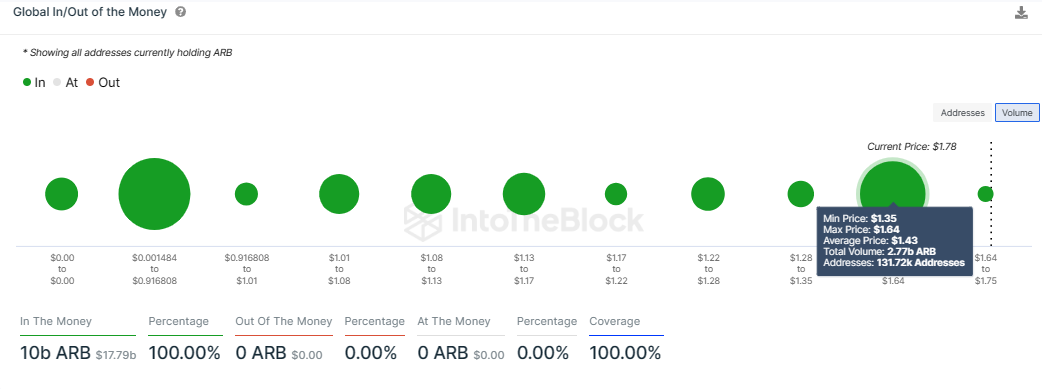
ARB GIOM
Cryptocurrency prices FAQs
How do new token launches or listings affect cryptocurrency prices?
Token launches like Arbitrum’s ARB airdrop and Optimism OP influence demand and adoption among market participants. Listings on crypto exchanges deepen the liquidity for an asset and add new participants to an asset’s network. This is typically bullish for a digital asset.
How do hacks affect cryptocurrency prices?
A hack is an event in which an attacker captures a large volume of the asset from a DeFi bridge or hot wallet of an exchange or any other crypto platform via exploits, bugs or other methods. The exploiter then transfers these tokens out of the exchange platforms to ultimately sell or swap the assets for other cryptocurrencies or stablecoins. Such events often involve an en masse panic triggering a sell-off in the affected assets.
How do macroeconomic releases and events affect cryptocurrency prices?
Macroeconomic events like the US Federal Reserve’s decision on interest rates influence risk assets like Bitcoin, mainly through the direct impact they have on the US Dollar. An increase in interest rate typically negatively influences Bitcoin and altcoin prices, and vice versa. If the US Dollar index declines, risk assets and associated leverage for trading gets cheaper, in turn driving crypto prices higher.
How do major crypto upgrades like halvings, hard forks affect cryptocurrency prices?
Halvings are typically considered bullish events as they slash the block reward in half for miners, constricting the supply of the asset. At consistent demand if the supply reduces, the asset’s price climbs. This has been observed in Bitcoin and Litecoin.
Recommended Articles


