


US Dollar gains as US-EU deal eases trade tensions
- The US Dollar begins the week on a firmer footing, supported by easing global trade tensions.
- A breakthrough US-EU trade agreement lifts market sentiment, reducing fears of a transatlantic trade war.
- The DXY US Dollar Index hovers around 98.25, holding above the 21-day EMA and key support at 97.80-98.00.
The US Dollar (USD) starts the week on a firmer note, extending its modest recovery since Thursday, as easing global trade tensions lift investor sentiment. Interestingly, the Greenback, which typically underperforms in a risk-on environment, is finding support despite improving risk appetite, underpinned by expectations that the Federal Reserve (Fed) will leave interest rates unchanged at its monetary policy decision on Wednesday. Notably, a flurry of trade agreements finalized last week is also acting as a tailwind for the Greenback, with the August 1 tariff deadline looming and keeping markets on edge.
The US Dollar Index (DXY), which tracks the value of the Greenback against a basket of six major currencies, extends gains for the third consecutive day, climbing nearly 0.50% during American trading hours as markets cheer the breakthrough trade agreement between the United States (US) and the European Union (EU). At the time of writing, the index is hovering around 98.15, marking its highest level in nearly a week.
The new US-EU framework trade agreement was finalized after US President Donald Trump and European Commission President Ursula von der Leyen met briefly at Trump’s Turnberry golf course in Scotland on Sunday. Under the agreement, the US will impose a 15% tariff levy on most EU imports such as cars, semiconductors, and pharmaceuticals, significantly lower than the previously threatened 30%. According to Reuters, that baseline rate is to be supplemented by “zero-for-zero” tariff exemptions covering strategic sectors including aircraft and parts, select chemicals, semiconductor manufacturing equipment, generic drugs, agricultural goods, and key raw materials.
In return, the EU has committed to purchasing $250 billion in US liquefied natural gas (LNG) annually, totaling roughly $750 billion over three years. The deal also outlines a $600 billion EU investment package in the US, focusing on strategic sectors such as clean energy, defense equipment, and manufacturing. While the agreement leaves existing steel and aluminum tariffs at 50%, officials hinted that a quota-based system could replace them in future negotiations.
Market Movers: Trade optimism lifts sentiment, but caution lingers ahead of Fed decision
- US President Donald Trump called the new US-EU trade agreement “the biggest deal ever made,” underscoring the EU's $750 billion commitment to purchase US energy and defense goods. His remarks helped reinforce market confidence that a broader trade war has been averted, providing a tailwind for the US Dollar and risk assets. S&P 500 futures climb 0.4% after the index reached five consecutive all-time highs last week. Contracts for European stocks raise 1% following the agreement.
- European Commission President Ursula von der Leyen acknowledged the deal was the result of “tough negotiations,” but emphasized it brings “stability and predictability in uncertain times.” Von der Leyen comments were interpreted as a pragmatic win for diplomacy. Meanwhile, German Chancellor Friedrich Merz welcomed the deal, stating that it "managed to preserve our fundamental interests," though he "would have wished for more relief in transatlantic trade." However, French and Hungarian leaders criticized the deal as overly one-sided. One Belgian official remarked, "Trump ate von der Leyen for breakfast," triggering debate across European markets.
- Despite initial market cheer, criticism from top economists has sparked caution. Economist Peter Schiff sharply criticized the trade agreement, warning that US consumers and industries will be net losers. Schiff pointed out that while Americans will face 15% tariffs on most European goods, essential raw materials like steel, aluminum, and copper could be taxed as high as 50%, driving up costs for American manufacturers. Meanwhile, European buyers reportedly face minimal tariff exposure on US imports. University of Michigan economist Justin Wolfers questioned the deal's merit, noting that tariffs of 1-2% have long driven trade policy, making the new framework appear outdated. Wolfers warned that even a 15% import tax can inflict serious harm, especially when US consumers bear the tariff burden.
- While Ursula von der Leyen had a clear mandate to negotiate the trade deal on behalf of the EU, the agreement still faces crucial hurdles before it becomes binding. The European Commission must now formally present the framework to both EU member states and the European Parliament, where approval from both bodies is required through the ordinary legislative procedure.
- High-level US-China trade talks are set to resume this week in Stockholm, with officials aiming to extend the current tariff truce ahead of the August 12 deadline. The meeting between US Treasury Secretary Scott Bessent and Chinese Vice Premier He Lifeng is seen as a critical step in preventing a re-escalation of tariffs, particularly on industrial and tech-related goods.
- US Commerce Secretary Howard Lutnick reaffirmed a hard stance on trade, telling reporters there will be “no extensions, no more grace periods” for the looming August 1 tariff deadline. “The rules are clear — tariffs kick in August 1 unless there’s a deal. Period.”
- While Monday offers a quiet start, the US economic docket ramps up sharply with key releases ahead: Tuesday features the Conference Board Consumer Confidence and JOLTS Job Openings report, Wednesday brings ADP Employment Change, Q2 US Gross Domestic Product (GDP), and the Fed's monetary policy decision, Thursday delivers Personal Consumption Expenditures (PCE) inflation and weekly Initial Jobless Claims; and Friday wraps with Nonfarm Payrolls (NFP), Average Hourly Earnings, and ISM Manufacturing Purchasing Managers Index (PMI) making it a pivotal week for markets.
Technical analysis: US Dollar Index rebounds from two-week low, eyes 50-day EMA breakout
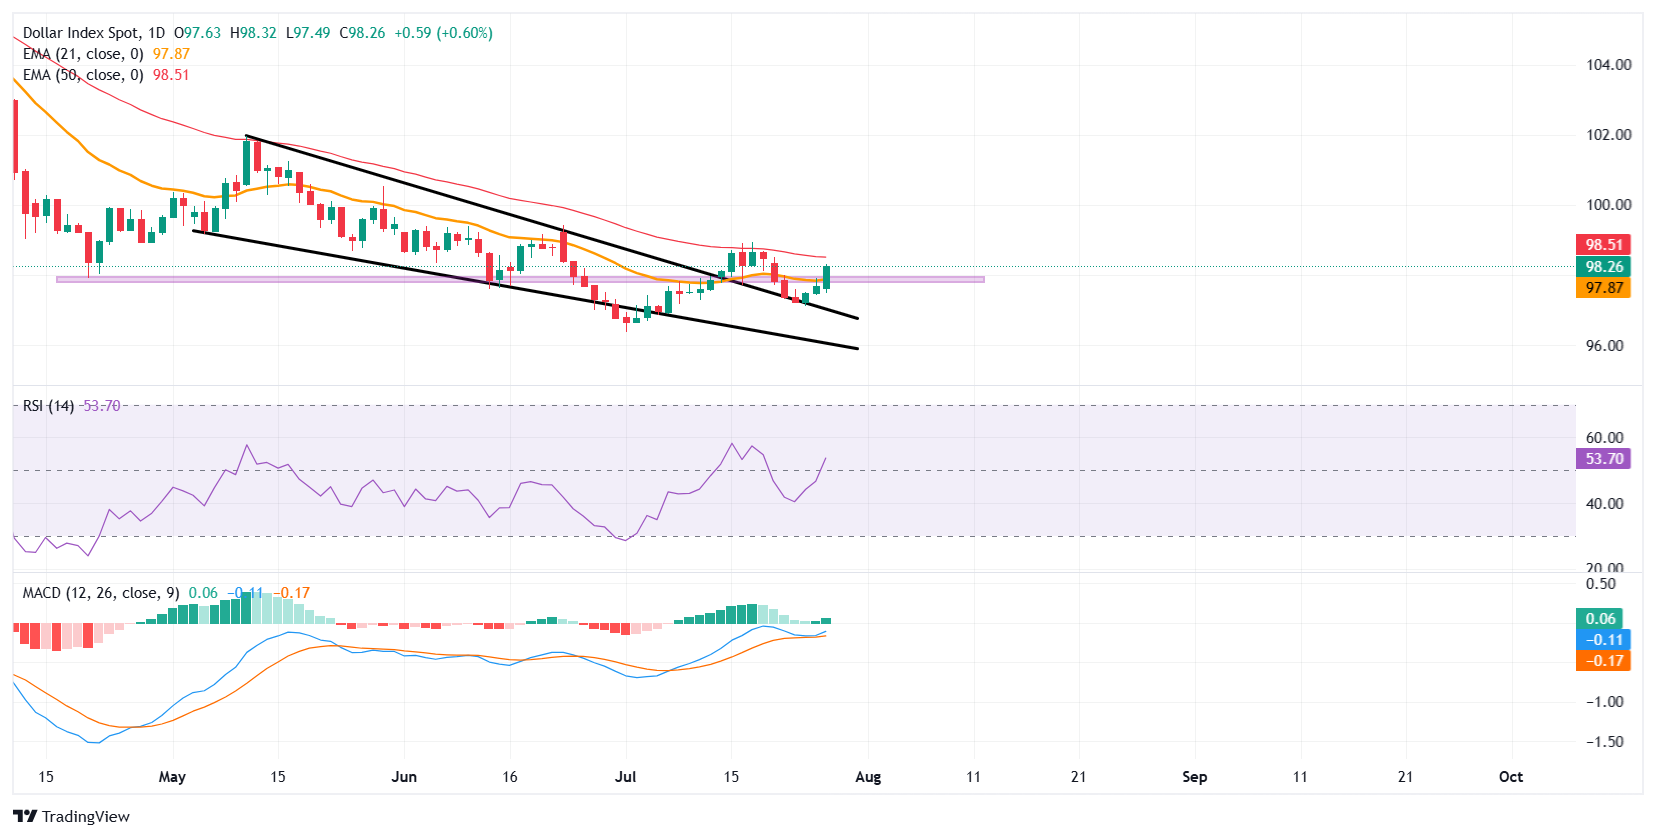
The US Dollar Index (DXY) has successfully retested the upper boundary of a falling wedge pattern, a bullish structure it broke out of earlier this month. After reaching a four-week high near the psychological 99.00 mark, the index failed to sustain momentum and reversed sharply lower, slipping to a two-week low near 97.00. However, buyers stepped back in near the wedge resistance-turned-support and defended the level, signaling that the breakout remains technically valid for now.
At the time of writing, DXY is hovering around 98.15, trading above the 21-day Exponential Moving Average (EMA) at 97.87, which coincides with a prior resistance-turned-support zone at 97.80-98.00. However, the 50-day EMA at 98.51 remains immediate resistance and must be cleared for the bulls to regain control. A successful break above this dynamic level could open the door for a retest of the 99.00 psychological zone. On the downside, failure to hold above 97.80 may trigger another retreat toward 97.50 and possibly 97.00.
The Relative Strength Index (RSI) on the daily chart has risen to 53, indicating renewed bullish momentum. The MACD remains in a bullish setup, with the blue MACD line holding above the orange signal line, although both remain below the zero mark, suggesting that the current rebound is still in the early stages of confirmation. The histogram has flipped into positive territory, reflecting improving upside momentum after last week's pullback.
US Dollar PRICE Today
The table below shows the percentage change of US Dollar (USD) against listed major currencies today. US Dollar was the strongest against the Euro.
| USD | EUR | GBP | JPY | CAD | AUD | NZD | CHF | |
|---|---|---|---|---|---|---|---|---|
| USD | 0.81% | -0.02% | 0.24% | 0.05% | 0.69% | 0.52% | 0.39% | |
| EUR | -0.81% | -0.85% | -0.55% | -0.76% | -0.12% | -0.29% | -0.42% | |
| GBP | 0.02% | 0.85% | 0.14% | 0.09% | 0.74% | 0.57% | 0.43% | |
| JPY | -0.24% | 0.55% | -0.14% | -0.17% | 0.42% | 0.28% | 0.31% | |
| CAD | -0.05% | 0.76% | -0.09% | 0.17% | 0.61% | 0.47% | 0.34% | |
| AUD | -0.69% | 0.12% | -0.74% | -0.42% | -0.61% | -0.17% | -0.30% | |
| NZD | -0.52% | 0.29% | -0.57% | -0.28% | -0.47% | 0.17% | -0.14% | |
| CHF | -0.39% | 0.42% | -0.43% | -0.31% | -0.34% | 0.30% | 0.14% |
The heat map shows percentage changes of major currencies against each other. The base currency is picked from the left column, while the quote currency is picked from the top row. For example, if you pick the US Dollar from the left column and move along the horizontal line to the Japanese Yen, the percentage change displayed in the box will represent USD (base)/JPY (quote).
Recommended Articles


