

Dow Jones Industrial Average softens, equities decline after US data deflates rate cut hopes
- Dow Jones backslid 0.6% after US Retail Sales, PPI inflation vex rate bets.
- US PPI inflation remains tight, as does the US labor market, Retail Sales recover.
- Declines across nearly all sectors pummel indexes.
The Dow Jones Industrial Average (DJIA) declined on Thursday after US data showed inflation, labor, and domestic consumer spending continue to run too hot, too tight, and too strong for markets broadly hoping for rate cuts from the Federal Reserve (Fed). Rate futures bets of a June rate cut receded after the US data print, and investors are pulling back from equities that have been testing all-time highs recently.
At the time of writing, the Real Estate and Utilities Sectors are the US market’s biggest losers, down 2.2% and 1.35% respectively. The upside remains thin, with the Energy Sector up a comparatively thin 0.8%, followed by Communication Services which is up around 0.5%.
Core US Producer Price Index (PPI) inflation held at 2.0% for the year ended February, refusing to ease to the median market forecast of 1.9%. Headline annualized PPI in February jumped to 1.6, well over the forecast uptick to 1.1%. The previous print of 0.9% was also revised slightly higher to 1.0%.
US Retail Sales recovered to 0.6% in February, rebounding from the previous month’s -1.1% decline (revised down from -0.8%). Retail Sales missed the forecast of 0.8%, but the recovery was still firm enough to throw cold water on rate cut bets that are leaning into hopes of an economic recession in the US.
Initial Jobless Claims for the week ended March 8 also printed stronger than expected, with 209K new jobless benefits seekers versus the forecast 218K. The previous week’s number of jobless claimants was revised to 210K from the initial print of 217K.
Dow Jones news
Of the thirty equities listed on the Dow Jones Industrial Average, only six are in the green on Thursday. Microsoft Corp. (MSFT) is leading the bull charge, climbing 2.6% on the day to trade above $426.00. Apple Inc. (AAPL) follows closely behind, rising 1.5% to trade into $174.00.
Telecoms and financials are dragging down the Dow Jones on Thursday. Verizon Communications Inc. (VZ) is down 1.8%, trading below $40.00 per share, while JPMorgan Chase & Co. (JPM) is in the red by 1.5% and trading down into $188.00 per share.
Dow Jones Industrial Average technical outlook
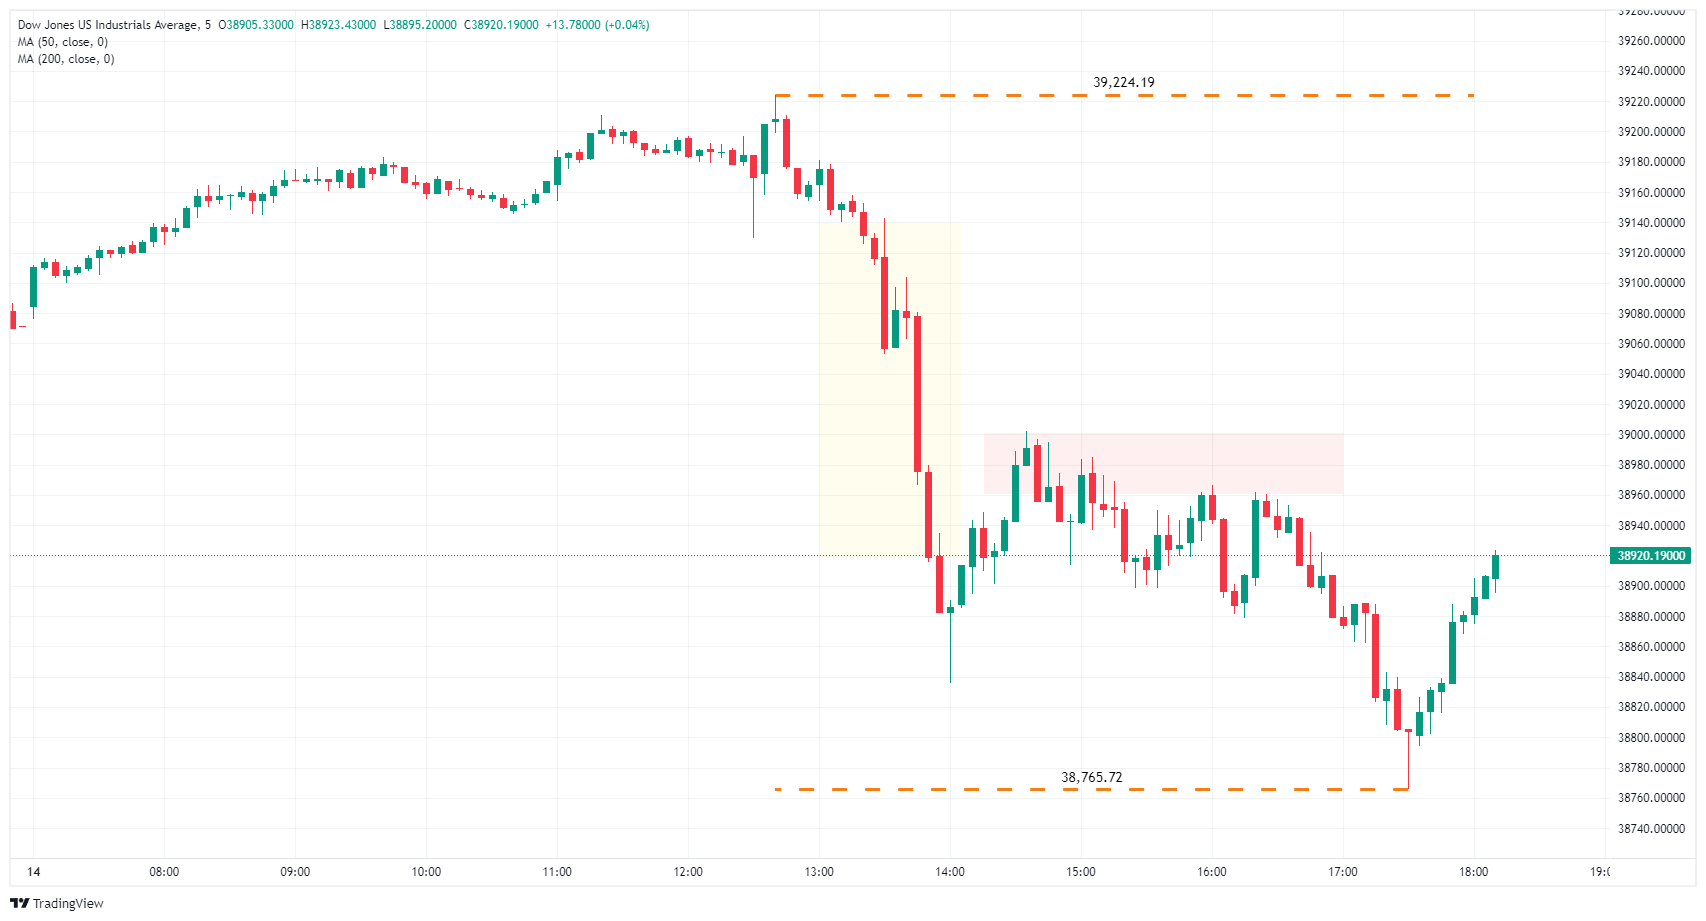
The Dow Jones Industrial Average (DJIA) printed an outside bar on Thursday, setting both a new high and a new low compared to the previous day. The Dow Jones set a new high for the week at 39,224.19 before getting swamped into a fresh low below 38,800.00.
The equity index has been pushed back below the 39,000.00 handle on Thursday. Bidders will note that the Dow Jones has a Fair Value Gap (FVG) ripe for the picking, while a supply zone is priced in from the 39,000.00 handle to 38,960.00.
Dow Jones Industrial Average, 5-minute chart
Dow Jones FAQs
The Dow Jones Industrial Average, one of the oldest stock market indices in the world, is compiled of the 30 most traded stocks in the US. The index is price-weighted rather than weighted by capitalization. It is calculated by summing the prices of the constituent stocks and dividing them by a factor, currently 0.152. The index was founded by Charles Dow, who also founded the Wall Street Journal. In later years it has been criticized for not being broadly representative enough because it only tracks 30 conglomerates, unlike broader indices such as the S&P 500.
Many different factors drive the Dow Jones Industrial Average (DJIA). The aggregate performance of the component companies revealed in quarterly company earnings reports is the main one. US and global macroeconomic data also contributes as it impacts on investor sentiment. The level of interest rates, set by the Federal Reserve (Fed), also influences the DJIA as it affects the cost of credit, on which many corporations are heavily reliant. Therefore, inflation can be a major driver as well as other metrics which impact the Fed decisions.
Dow Theory is a method for identifying the primary trend of the stock market developed by Charles Dow. A key step is to compare the direction of the Dow Jones Industrial Average (DJIA) and the Dow Jones Transportation Average (DJTA) and only follow trends where both are moving in the same direction. Volume is a confirmatory criteria. The theory uses elements of peak and trough analysis. Dow’s theory posits three trend phases: accumulation, when smart money starts buying or selling; public participation, when the wider public joins in; and distribution, when the smart money exits.
There are a number of ways to trade the DJIA. One is to use ETFs which allow investors to trade the DJIA as a single security, rather than having to buy shares in all 30 constituent companies. A leading example is the SPDR Dow Jones Industrial Average ETF (DIA). DJIA futures contracts enable traders to speculate on the future value of the index and Options provide the right, but not the obligation, to buy or sell the index at a predetermined price in the future. Mutual funds enable investors to buy a share of a diversified portfolio of DJIA stocks thus providing exposure to the overall index.
Recommended Articles


