
US Dollar weakens as fiscal, tariff risks mount
- The US Dollar index slides for the ninth consecutive trading day, hitting its lowest level since February 2022.
- The Greenback posts its worst first-half performance since 1973, down over 10% in H1 2025.
- Market attention turns to Fed Powell’s speech, ISM Manufacturing PMI, and JOLTS data for near-term direction.
The US Dollar (USD) continues to face selling pressure, with the US Dollar Index (DXY) currently trading around 96.45, its lowest level since February 2022, as it continues its descent for the ninth straight day. Persistent concerns over US fiscal stability, tariff tensions, and political pressure on the Federal Reserve (Fed) are keeping the Greenback on the back foot.
The DXY has now ended the last six consecutive months in the red, declining over 10% in the first half of 2025 — its worst first-half performance since currencies began floating in 1973, with the second quarter alone marking its steepest quarterly drop since Q4 2022. The US Dollar weakened against all major G10 currencies during this period as investors sold off dollar-denominated assets.
Multiple key factors have driven the US Dollar’s sharp decline over the past quarter, but the Greenback’s weakness is primarily due to the unpredictable trade and economic policies of US President Donald Trump. His massive tax-and-spending proposal, known as the “One Big Beautiful Bill,” has made investors nervous. The bill, which includes permanent tax cuts and deep spending overhauls, is fueling concerns about fiscal instability and could add more than $3.3 trillion to the national debt.
Adding to the pressure, with the July 9 deadline looming, Trump’s push for sweeping tariffs is adding to uncertainty around global trade and economic policy. With less than a week to go, only a tentative agreement with the UK and a de-escalation with China have been reached, while talks with other key trading partners remain stalled. The US administration also appears to be retreating from its idea of “90 trade deals in 90 days”. Rather than securing comprehensive trade deals, the focus now seems to be shifting toward interim agreements, while retaining a 10% import tax that ultimately falls on US consumers.
Market movers: Rate cut bets, political pressure, and tariffs
- Political interference continues to weigh on the US Dollar, as US President Donald Trump expanded his criticism beyond Fed Chair Jerome Powell to the entire Federal Reserve Board. On Monday, Trump called for an aggressive rate cut to “1% or better,” reigniting concerns about the central bank’s independence. Treasury Secretary Scott Bessent echoed the sentiment, saying Fed officials “seem a little frozen at the wheel” and suggesting they are hesitating in their policy response. He also downplayed inflation risks from tariffs, adding, “We have seen no inflation from tariffs,” which may signal pressure for further policy easing despite macro uncertainty.
- According to a report by BHH Marketview, US 2-year Treasury yields have dropped to a two-month low of 3.71% as Fed funds futures shift to price in deeper policy easing. Markets now expect the Fed to cut rates by 125 basis points over the next year, bringing the target range down to 3.00%–3.25%. In contrast, most other major central banks are nearing the end of their easing cycles. The report highlights that narrowing US–G6 2-year bond yield spreads could weigh further on the US Dollar.
- With less than a week to go, President Trump has made it clear he does not plan to extend the tariff pause beyond July 9. In an interview with Fox News Channel’s Sunday Morning Futures, Trump said letters will be sent to countries notifying them of new tariff rates if deals are not reached. “We’ll look at how a country treats us — are they good, are they not so good — some countries we don’t care, we’ll just send a high number out,” he said.
- The “One Big Beautiful Bill”, a sweeping tax-and-spending package by President Donald Trump, is now in a critical "vote-a-rama" session in the US Senate as Republicans push to meet a self-imposed July 4 deadline. The 940-page bill narrowly cleared a procedural hurdle over the weekend but now faces many changes. Democrats are pushing to remove parts they disagree with, especially big cuts to Medicaid and food stamps, and tax breaks that mostly help the wealthy. The high-stakes legislative battle is adding to fiscal uncertainty and weighing on US Dollar sentiment.
- Fed Chair Jerome Powell is scheduled to speak at the ECB Forum in Sintra, Portugal, on Tuesday — an event often compared to Jackson Hole. Markets are watching closely for hints on the Fed’s next move amid growing pressure from President Trump and Treasury Secretary Bessent to cut rates faster.
- Later on Tuesday, markets will get fresh updates on the US economy with the release of the June ISM Manufacturing PMI and May JOLTS Job Openings. The ISM index is expected to inch up to 48.8 from 48.5 in May, but still remain in contraction territory. Meanwhile, job openings are projected to ease slightly to 7.3 million, down from 7.391 million in April. Any downside surprises could strengthen the case for Fed rate cuts and keep the Dollar under pressure, while stronger-than-expected figures might offer brief relief for the Greenback.
Technical analysis: Greenback slips below wedge support
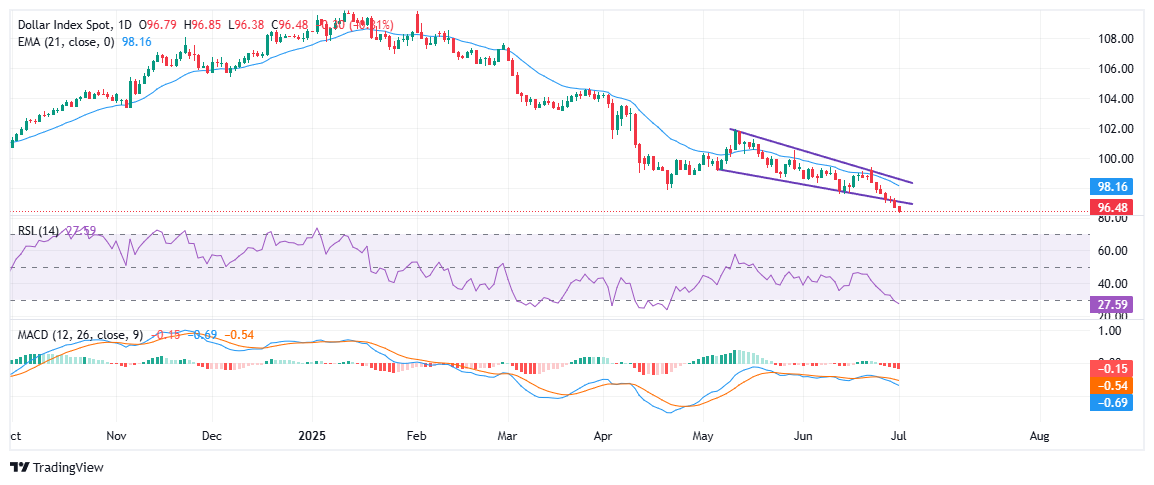
The US Dollar Index (DXY) continues to trade under sustained bearish pressure, recently breaking below the lower boundary of a descending wedge pattern that has guided price action since mid-May. The index is now hovering around 96.45, its lowest level since February 2022, and remains well below the 21-day Exponential Moving Average (EMA), currently at 98.16. This consistent rejection from the EMA highlights the strength of the prevailing downtrend. The breakdown from the wedge suggests a possible acceleration in bearish pressure, with no immediate signs of a reversal.
Momentum indicators further confirm the negative outlook. The Relative Strength Index (RSI) has dropped to 27.59, entering oversold territory, which could signal a potential short-term bounce, although it may also reflect the intensity of the current selling pressure. Meanwhile, the Moving Average Convergence Divergence (MACD) histogram remains in negative territory, with the MACD line widening below the signal line, reinforcing the bearish trend. Unless DXY can reclaim and hold above the 98.00–97.80 zone, the path of least resistance remains to the downside, with eyes now on the next key support around the 96.00 round level.
US Dollar PRICE Today
The table below shows the percentage change of US Dollar (USD) against listed major currencies today. US Dollar was the strongest against the Canadian Dollar.
| USD | EUR | GBP | JPY | CAD | AUD | NZD | CHF | |
|---|---|---|---|---|---|---|---|---|
| USD | -0.15% | -0.11% | -0.72% | 0.12% | 0.00% | -0.20% | -0.40% | |
| EUR | 0.15% | 0.06% | -0.66% | 0.27% | 0.25% | -0.06% | -0.24% | |
| GBP | 0.11% | -0.06% | -0.59% | 0.24% | 0.20% | -0.11% | -0.28% | |
| JPY | 0.72% | 0.66% | 0.59% | 0.89% | 0.73% | 0.51% | 0.33% | |
| CAD | -0.12% | -0.27% | -0.24% | -0.89% | -0.12% | -0.35% | -0.53% | |
| AUD | -0.01% | -0.25% | -0.20% | -0.73% | 0.12% | -0.30% | -0.49% | |
| NZD | 0.20% | 0.06% | 0.11% | -0.51% | 0.35% | 0.30% | -0.18% | |
| CHF | 0.40% | 0.24% | 0.28% | -0.33% | 0.53% | 0.49% | 0.18% |
The heat map shows percentage changes of major currencies against each other. The base currency is picked from the left column, while the quote currency is picked from the top row. For example, if you pick the US Dollar from the left column and move along the horizontal line to the Japanese Yen, the percentage change displayed in the box will represent USD (base)/JPY (quote).
Recommended Articles


