

Dow Jones Industrial Average stalls recovery on volatile Friday
- The Dow Jones waffled near 42,000 as equities trim gains on Friday.
- Despite a lack of noteworthy data, equities are reeling under the pressure of expiries.
- President Trump hinted at “flexibility” in upcoming tariffs as the pivot begins anew.
The Dow Jones Industrial Average (DJIA) saw an uptick in volatility on Friday, but settled close to where it started near 42,000 as investors grapple with deciding where to go next. Despite a relatively thin showing on the economic data docket, market sentiment remains tightly-drawn as traders wrestle with fresh inconsistencies from US President Donald Trump.
Adding further pressure to equities, Friday was a “quadruple witching hour” for markets, with a jumbo proportion of options slated for expiry. According to estimates by Goldman Sachs (CS) and reported by CNBC Sean Conlon, over $4.7 trillion worth of stock, index, and futures options will expire on Friday.
After weeks of flip-flopping on recent tariff packages, but still vowing “reciprocal” tariffs on April 2nd, US President Donald Trump has again opened the door to “flexibility” to his previously-declared set in stone tariffs package due in early April. In a social media post on Friday morning, President Trump reiterated that the US will be imposing reciprocal tariffs on any country that has tariffs on US exports, but teased that there could be some “flexibility” in tariffs, opening the door to countries being able to negotiate down or away US import taxes. This is the sixth straight time in less than ten weeks that Donald Trump’s own tariff proposals have been changed by Donald Trump himself, and investors have grown weary under the weight of Trump’s on-again off-again trade war with everybody at the same time.
The Federal Reserve (Fed) towed the line this week, brushing off recent jumps in inflation metrics and generally waving off warning signs that have begun to crop up in economic data. Fed Chair Jerome Powell and the Federal Open Market Committee (FOMC) still see US interest rates declining by another 50 bps through the rest of 2025. According to the CME’s FedWatch Tool, rate traders are pricing in a nearly 80% chance that the Fed’s next quarter-point cut will be coming at the US central bank’s rate call on June 18.
Stocks news
Despite a charged Friday, US equity indexes remain close to the day’s opening bids. Most of the US stock sectors are testing slightly into the red, offsetting gains in key names like Boeing (BA), which is extending a recent recovery and climbing over 4% to regain $180 per share.
Dow Jones price forecast
The Dow Jones continues to churn just south of key price levels, marking in several failed attempts to crack back through the 200-day Exponential Moving Average (EMA) near the 42,000 major price handle. Price action is still tilted in favor of buyers, but a lack of topside momentum is keeping bids hobbled by a new technical ceiling.
Dow Jones daily chart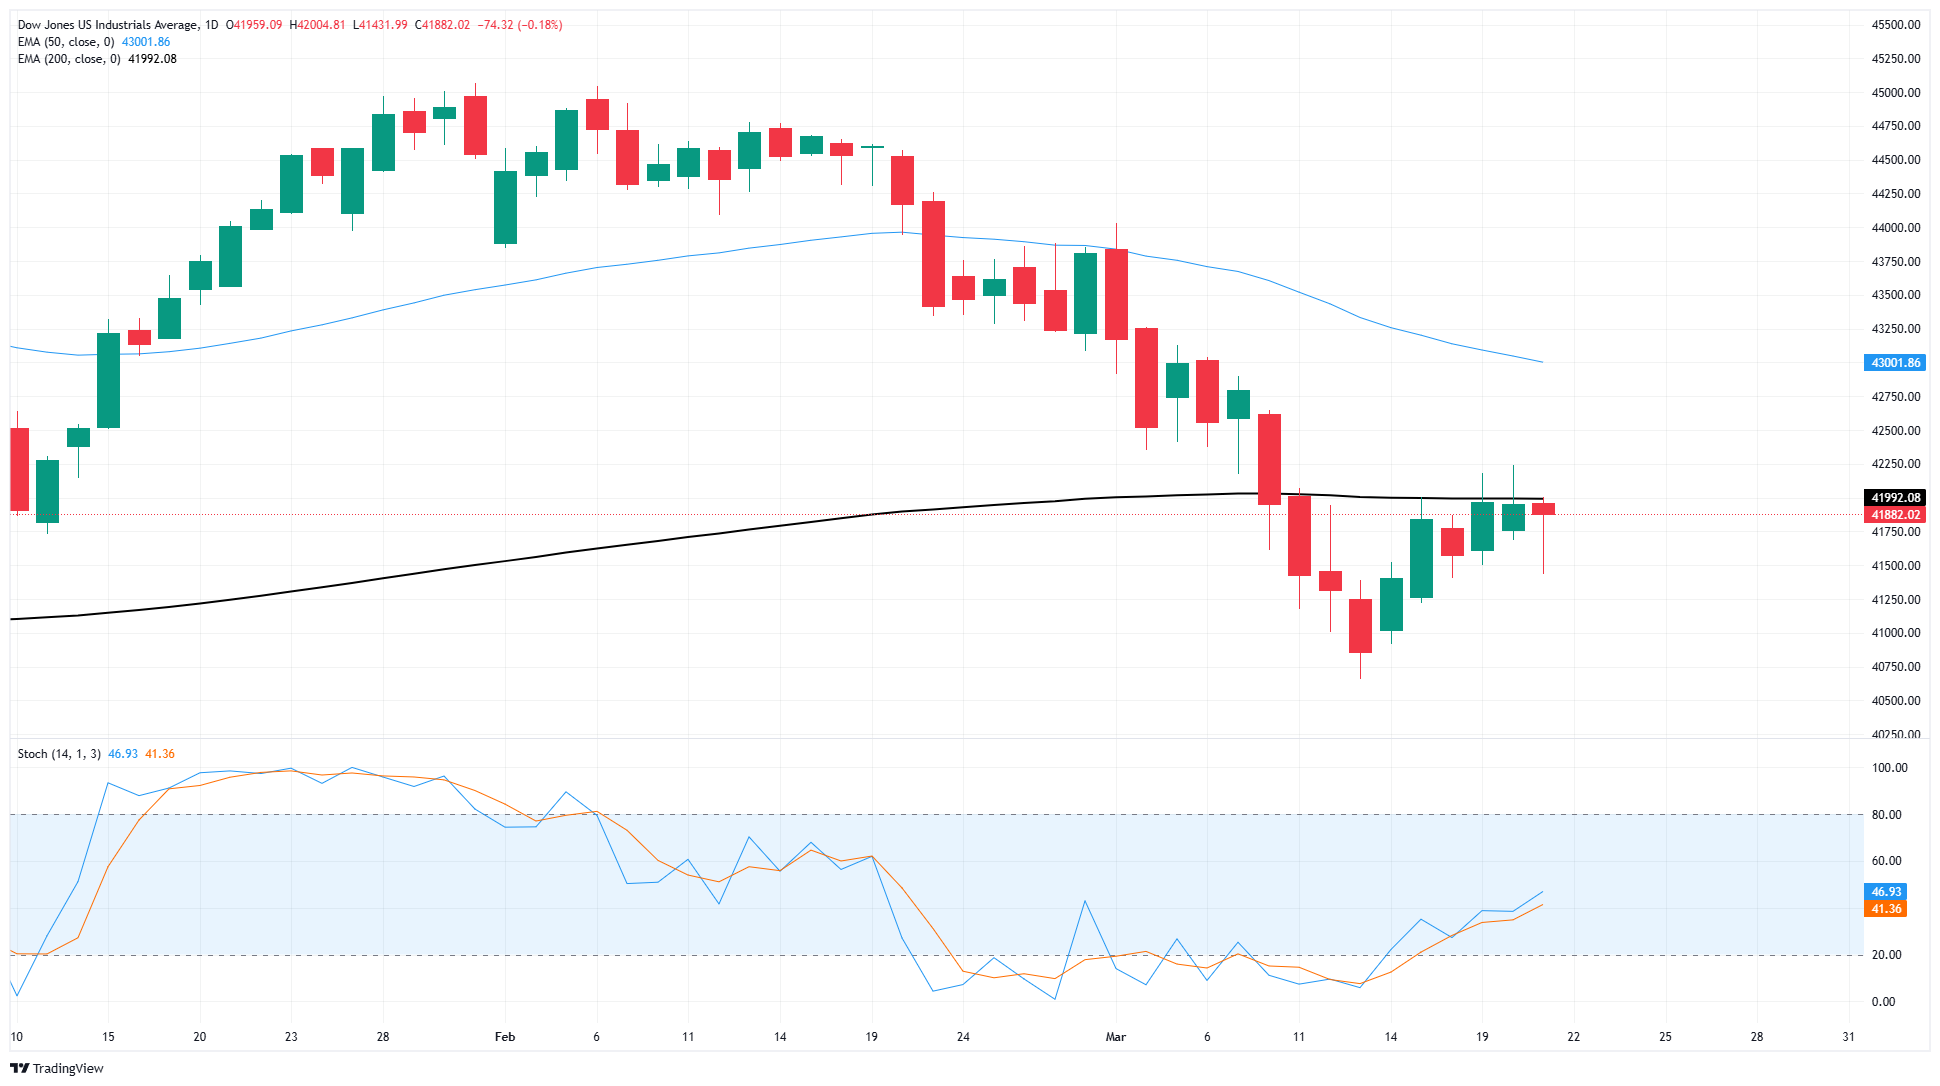
Dow Jones FAQs
The Dow Jones Industrial Average, one of the oldest stock market indices in the world, is compiled of the 30 most traded stocks in the US. The index is price-weighted rather than weighted by capitalization. It is calculated by summing the prices of the constituent stocks and dividing them by a factor, currently 0.152. The index was founded by Charles Dow, who also founded the Wall Street Journal. In later years it has been criticized for not being broadly representative enough because it only tracks 30 conglomerates, unlike broader indices such as the S&P 500.
Many different factors drive the Dow Jones Industrial Average (DJIA). The aggregate performance of the component companies revealed in quarterly company earnings reports is the main one. US and global macroeconomic data also contributes as it impacts on investor sentiment. The level of interest rates, set by the Federal Reserve (Fed), also influences the DJIA as it affects the cost of credit, on which many corporations are heavily reliant. Therefore, inflation can be a major driver as well as other metrics which impact the Fed decisions.
Dow Theory is a method for identifying the primary trend of the stock market developed by Charles Dow. A key step is to compare the direction of the Dow Jones Industrial Average (DJIA) and the Dow Jones Transportation Average (DJTA) and only follow trends where both are moving in the same direction. Volume is a confirmatory criteria. The theory uses elements of peak and trough analysis. Dow’s theory posits three trend phases: accumulation, when smart money starts buying or selling; public participation, when the wider public joins in; and distribution, when the smart money exits.
There are a number of ways to trade the DJIA. One is to use ETFs which allow investors to trade the DJIA as a single security, rather than having to buy shares in all 30 constituent companies. A leading example is the SPDR Dow Jones Industrial Average ETF (DIA). DJIA futures contracts enable traders to speculate on the future value of the index and Options provide the right, but not the obligation, to buy or sell the index at a predetermined price in the future. Mutual funds enable investors to buy a share of a diversified portfolio of DJIA stocks thus providing exposure to the overall index.
Recommended Articles


