

Dow Jones Industrial Average declines once more as tariff confusion grips markets
- The Dow Jones shed around 575 points on Thursday, as trade war fears resume.
- The more the Trump administration tries to soothe tariff fears, the worse things get.
- Market sentiment is still churning despite announced tariff delays and upbeat jobs data.
The Dow Jones Industrial Average turned tail and ran on Thursday, in tandem with the rest of the US equity indexes. United States (US) President Donald Trump continues to waffle on his own trade war rhetoric, exploring tariff exemptions and extensions on a sector-by-sector basis. However, the lack of clarity and consistency in policy that tends to get announced off-the-cuff via social media posting is beginning to weigh on market sentiment.
The Trump administration is continuing to pivot on its own tariff threats, granting a 30-day reprieve for the US automotive industry, which remains heavily reliant on foreign trade to produce its vehicles. Other industries, sectors, and businesses are up for making a case for why they should receive an exemption, at least for a little while, and the ongoing uncertainty around President Trump’s trade war rhetoric is sinking investor risk appetite.
US Nonfarm Payrolls (NFP) net job gains numbers for February are due on Friday, and Thursday’s Challenger Job Cuts number is providing little reason for traders to hope for a decent NFP print this week. Challenger firings reached their highest level since August of 2020 in February, climbing to 172K net terminations in key industries, strongly implying that a general slowdown is gathering speed.
Dow Jones news
Nearly the entire Dow Jones equity board is falling back on Thursday, with all but three listed securities trading into the red. Verizon Communications still managed to find some gains, climbing 1.2% to cross above $43 per share. Nvidia (NVDA) fell back once again, falling nearly 5% and dipping below $112 per share as the AI trade continues to fizzle out.
Dow Jones price forecast
Thursday is turning into a lunchbag letdown for bullish hopefuls, shredding the midweek rebound that has vanished as quickly as it disappeared. The Dow Jones is trading back into the 42,500 handle, with a near-term technical floor priced in at the 42,400 level.
The Dow Jones is poised to make contact with the 200-day Exponential Moving Average (EMA) near the 42,000 key figure, but only if selling pressure is able to push bids down another 500 points, a move that would likely require a shift in fundamentals... or a bad employment data print.
Dow Jones daily chart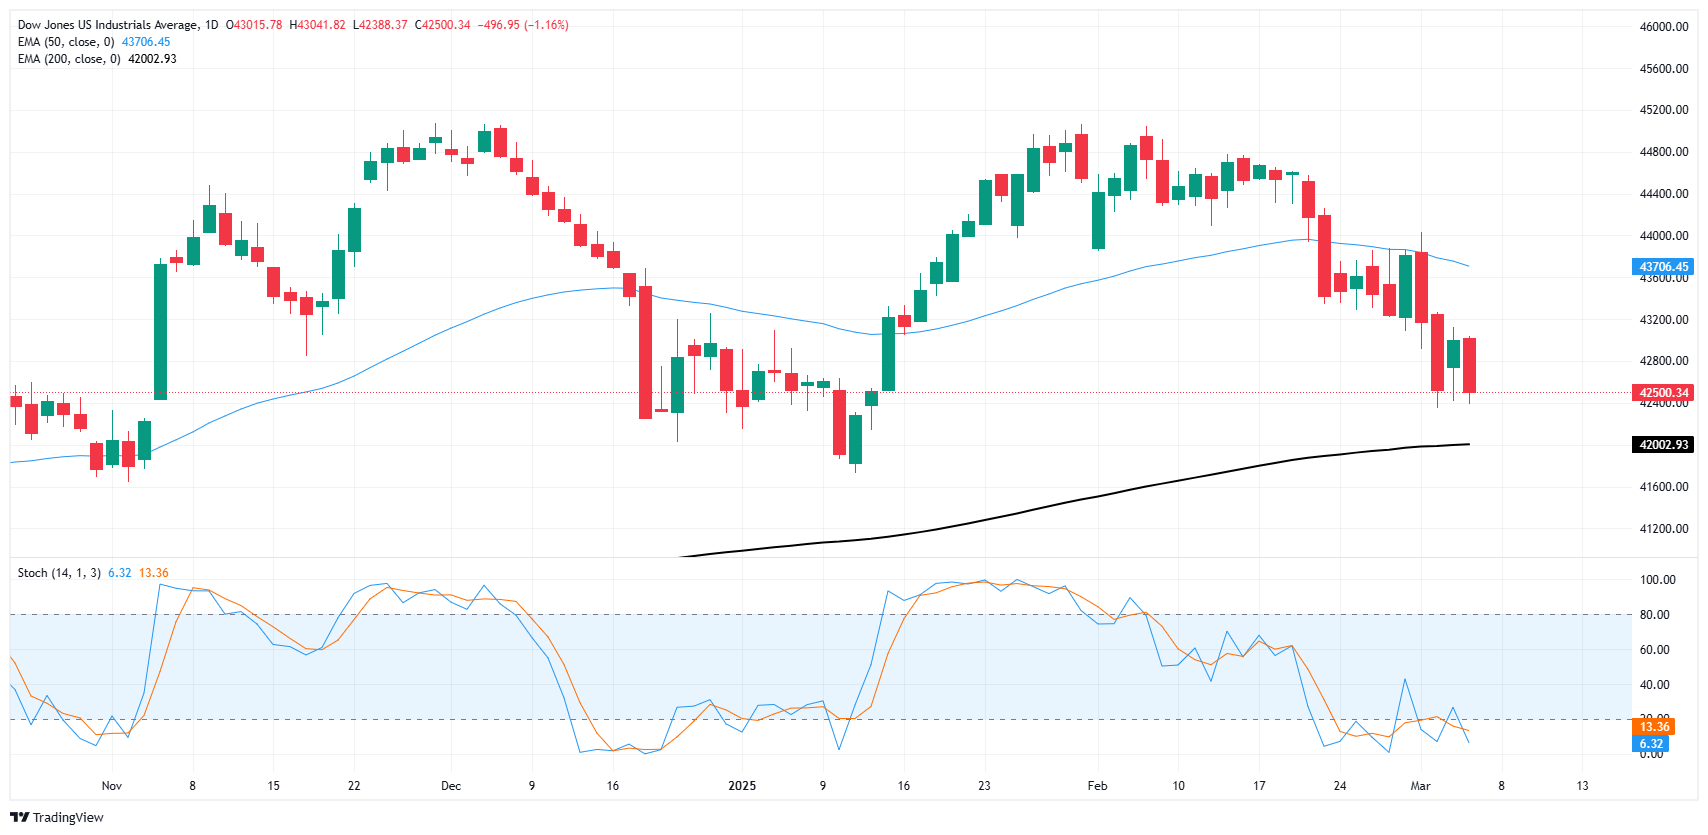
Dow Jones FAQs
The Dow Jones Industrial Average, one of the oldest stock market indices in the world, is compiled of the 30 most traded stocks in the US. The index is price-weighted rather than weighted by capitalization. It is calculated by summing the prices of the constituent stocks and dividing them by a factor, currently 0.152. The index was founded by Charles Dow, who also founded the Wall Street Journal. In later years it has been criticized for not being broadly representative enough because it only tracks 30 conglomerates, unlike broader indices such as the S&P 500.
Many different factors drive the Dow Jones Industrial Average (DJIA). The aggregate performance of the component companies revealed in quarterly company earnings reports is the main one. US and global macroeconomic data also contributes as it impacts on investor sentiment. The level of interest rates, set by the Federal Reserve (Fed), also influences the DJIA as it affects the cost of credit, on which many corporations are heavily reliant. Therefore, inflation can be a major driver as well as other metrics which impact the Fed decisions.
Dow Theory is a method for identifying the primary trend of the stock market developed by Charles Dow. A key step is to compare the direction of the Dow Jones Industrial Average (DJIA) and the Dow Jones Transportation Average (DJTA) and only follow trends where both are moving in the same direction. Volume is a confirmatory criteria. The theory uses elements of peak and trough analysis. Dow’s theory posits three trend phases: accumulation, when smart money starts buying or selling; public participation, when the wider public joins in; and distribution, when the smart money exits.
There are a number of ways to trade the DJIA. One is to use ETFs which allow investors to trade the DJIA as a single security, rather than having to buy shares in all 30 constituent companies. A leading example is the SPDR Dow Jones Industrial Average ETF (DIA). DJIA futures contracts enable traders to speculate on the future value of the index and Options provide the right, but not the obligation, to buy or sell the index at a predetermined price in the future. Mutual funds enable investors to buy a share of a diversified portfolio of DJIA stocks thus providing exposure to the overall index.
Recommended Articles


