

US Dollar gains as US-Russia talks show little progress
- The DXY climbs above 107.00 amid geopolitical tensions.
- Russia sees no reason for a Trump-Putin meeting as demands remain unresolved.
- Empire State Manufacturing Index surprises with a return to positive territory.
The US Dollar Index (DXY), which tracks the US Dollar's (USD) performance against six major currencies, rises on Tuesday as traders react to discouraging headlines from the United States (US)-Russia talks in Riyadh. Despite efforts to negotiate a ceasefire or peace deal for Ukraine, Russia has dismissed the need for a Trump-Putin meeting this month, citing ongoing demands. At the time of writing, the DXY hovers above 107.00, fueled by geopolitical uncertainties.
Daily digest market movers: US Dollar rises as Russia dismisses Trump-Putin meeting
- Geopolitical risks support the US Dollar as US-Russia talks in Riyadh show no progress.
- Russia states that a Trump-Putin meeting is unnecessary due to unresolved demands and the previous sparks of hope of a hypothetical ceasefire seem to be fading away.
- On the Ukrainian side, President Volodymyr Zelensky commented that “fair” negotiations to end the war with Russia must involve Ukraine and Europe, also contributing to a negative market environment.
- On the data front, the New York Empire State Manufacturing Index for February jumped to positive territory after months of contraction but had little impact on the USD.
- Federal Reserve officials continue to assess the impact of holding interest rates steady and maintain a cautious stance. In fact, the Fed’s sentiment index on the daily chart continues to be stuck in hawkish terrain.
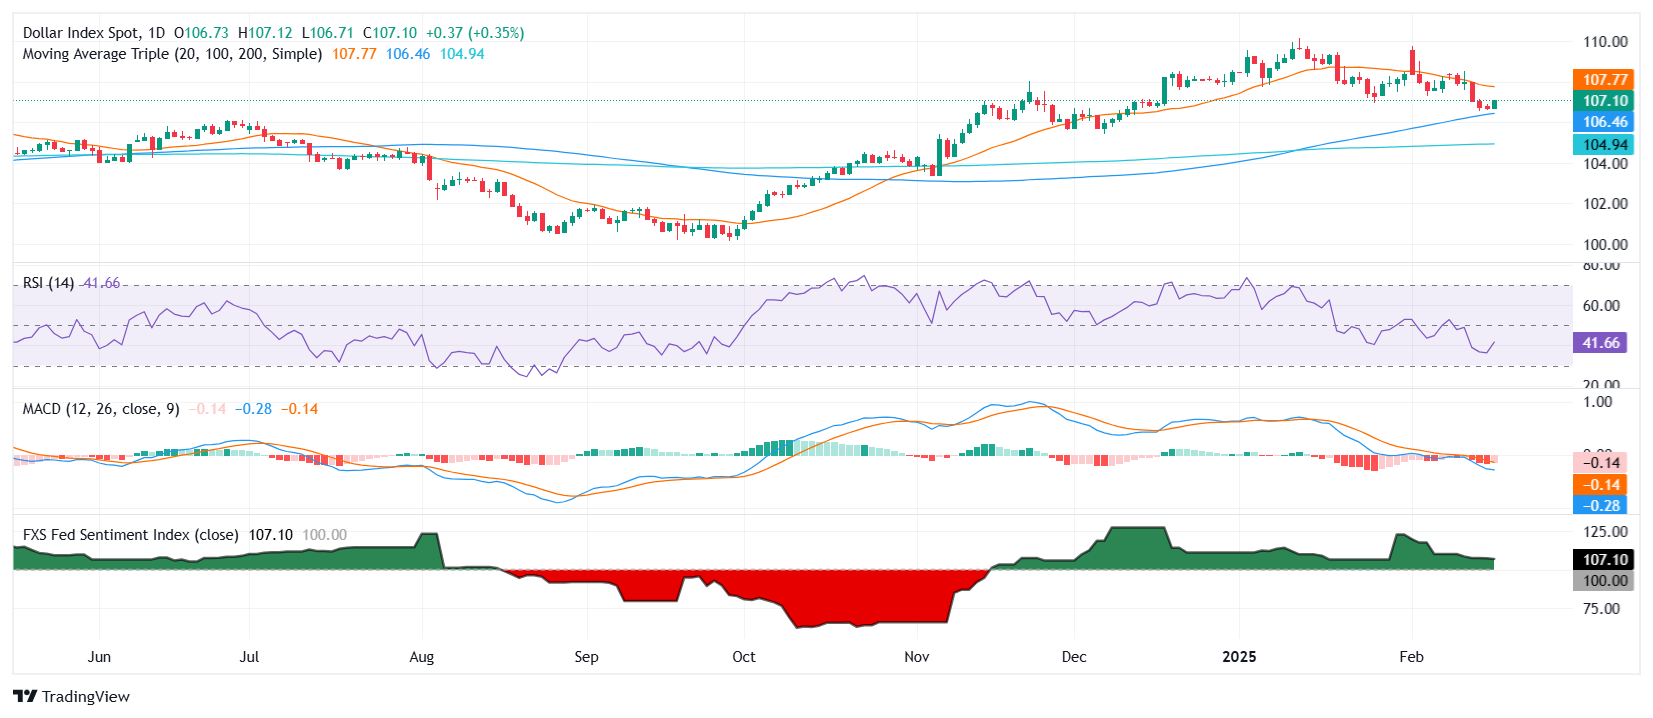
DXY technical outlook: Key resistance at 107.50, but downside risks persist
The US Dollar Index struggles to sustain gains after reclaiming the 107.00 level. Despite this mild rebound, the 20-day Simple Moving Average (SMA) remains a key resistance after being lost last week. The Relative Strength Index (RSI) is entrenched in negative territory, while the Moving Average Convergence Divergence (MACD) signals steady bearish momentum. Immediate support is seen at the 100-day SMA at 106.30, and a break below this level could confirm a short-term bearish outlook. Bulls need stronger momentum to challenge 107.50.
US Dollar FAQs
The US Dollar (USD) is the official currency of the United States of America, and the ‘de facto’ currency of a significant number of other countries where it is found in circulation alongside local notes. It is the most heavily traded currency in the world, accounting for over 88% of all global foreign exchange turnover, or an average of $6.6 trillion in transactions per day, according to data from 2022. Following the second world war, the USD took over from the British Pound as the world’s reserve currency. For most of its history, the US Dollar was backed by Gold, until the Bretton Woods Agreement in 1971 when the Gold Standard went away.
The most important single factor impacting on the value of the US Dollar is monetary policy, which is shaped by the Federal Reserve (Fed). The Fed has two mandates: to achieve price stability (control inflation) and foster full employment. Its primary tool to achieve these two goals is by adjusting interest rates. When prices are rising too quickly and inflation is above the Fed’s 2% target, the Fed will raise rates, which helps the USD value. When inflation falls below 2% or the Unemployment Rate is too high, the Fed may lower interest rates, which weighs on the Greenback.
In extreme situations, the Federal Reserve can also print more Dollars and enact quantitative easing (QE). QE is the process by which the Fed substantially increases the flow of credit in a stuck financial system. It is a non-standard policy measure used when credit has dried up because banks will not lend to each other (out of the fear of counterparty default). It is a last resort when simply lowering interest rates is unlikely to achieve the necessary result. It was the Fed’s weapon of choice to combat the credit crunch that occurred during the Great Financial Crisis in 2008. It involves the Fed printing more Dollars and using them to buy US government bonds predominantly from financial institutions. QE usually leads to a weaker US Dollar.
Quantitative tightening (QT) is the reverse process whereby the Federal Reserve stops buying bonds from financial institutions and does not reinvest the principal from the bonds it holds maturing in new purchases. It is usually positive for the US Dollar.
Recommended Articles


