

Dow Jones Industrial Average tumbles as US inflation kicks higher
- The Dow Jones shed over 400 points on Wednesday at its lowest.
- Fed Chair Powell made his second appearance in two days.
- Rate markets have pushed bets of the next Fed rate cut to December.
The Dow Jones Industrial Average (DJIA) tumbled on Wednesday,dropping over 400 points at its lowest and dipping into 44090. Investor sentiment took a beating after United States (US) Consumer Price Index (CPI) inflation showed the US has made no progress on bringing down core inflation metrics in eight months. It has been nearly four years since annualized US core CPI was below 3.0%.
Jerome Powell Testimony Live: We are not there on inflation
Federal Reserve (Fed) Chair Jerome Powell made his second appearance in as many days as the Fed head testified before US government bodies, delivering the Fed’s Monetary Policy Report to the House Financial Services Committee. Given the latest CPI print, Powell noted that the Fed has still not achieved its inflation goals, but he acknowledged that the Fed has made significant progress. Ongoing tariff spats between the US and everybody else have thrown a wrench in the works, making it challenging to forecast what monetary policy will look like in the face of an ambiguous US trade policy future.
Headline CPI inflation rose to 0.5% MoM, above the forecast decline to 0.3% from 0.4%. Annualized headline CPI also rose to 3.0%, beating the expected hold at 2.9%. On core CPI inflation, the yearly figure came in at 3.3%, while markets were expecting a cooling to 3.1% from 3.2%, with the monthly figure also rising sharply to 0.4%, beating the forecast of 0.3% and last 0.2%. Rate markets now expect the Fed to deliver its next rate cut very late in the year, with bets clustered around December.
Dow Jones news
Nearly the entire Dow Jones equity board lost ground on Wednesday, although Boeing (BA) and Walmart (WMT) managed to stake out room on the green side. Both companies gained around 1.2%, with Boeing rising to $104 per share and Walmart testing above $182.
On the low end, Caterpillar (CAT) and Home Depot (HD) both shed around 2% as inflation metrics take a bite out of machine and building material suppliers. Caterpillar fell below $355 per share, with Home Depot sinking below $410.
Dow Jones price forecast
Despite intraday losses, the Dow Jones continues to grind its way through the chart churn, holding in familiar technical territory. The Dow hasn’t made a fresh high since late November of last year, but downside momentum remains limited. Price action remains bolstered above the 50-day Exponential Moving Average (EMA) near 43,800, and the overall trend still tilts in favor of the bulls.
Dow Jones daily chart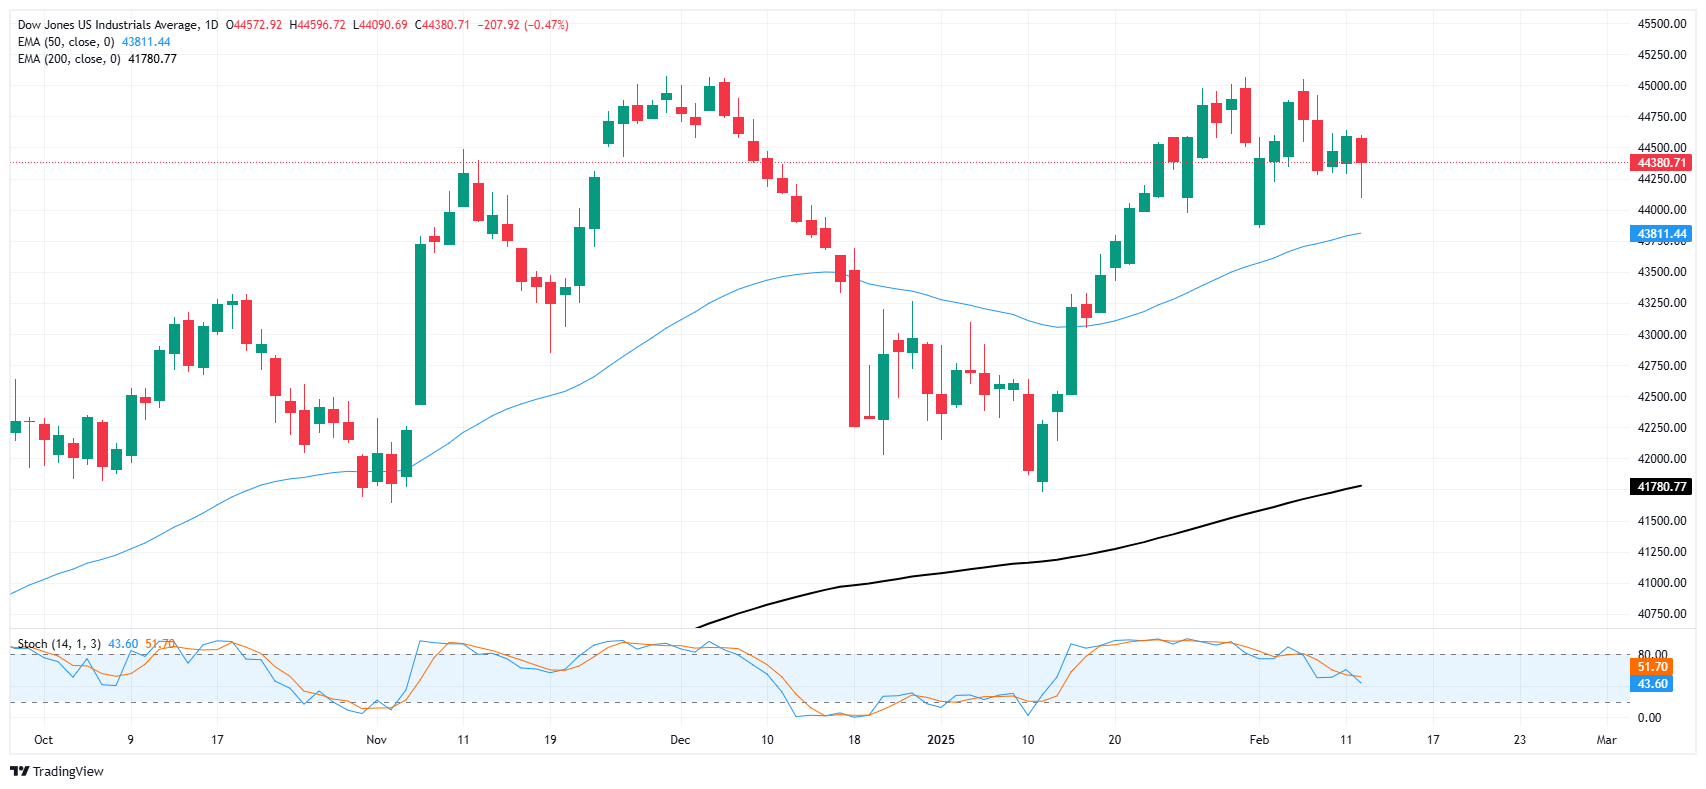
Dow Jones FAQs
The Dow Jones Industrial Average, one of the oldest stock market indices in the world, is compiled of the 30 most traded stocks in the US. The index is price-weighted rather than weighted by capitalization. It is calculated by summing the prices of the constituent stocks and dividing them by a factor, currently 0.152. The index was founded by Charles Dow, who also founded the Wall Street Journal. In later years it has been criticized for not being broadly representative enough because it only tracks 30 conglomerates, unlike broader indices such as the S&P 500.
Many different factors drive the Dow Jones Industrial Average (DJIA). The aggregate performance of the component companies revealed in quarterly company earnings reports is the main one. US and global macroeconomic data also contributes as it impacts on investor sentiment. The level of interest rates, set by the Federal Reserve (Fed), also influences the DJIA as it affects the cost of credit, on which many corporations are heavily reliant. Therefore, inflation can be a major driver as well as other metrics which impact the Fed decisions.
Dow Theory is a method for identifying the primary trend of the stock market developed by Charles Dow. A key step is to compare the direction of the Dow Jones Industrial Average (DJIA) and the Dow Jones Transportation Average (DJTA) and only follow trends where both are moving in the same direction. Volume is a confirmatory criteria. The theory uses elements of peak and trough analysis. Dow’s theory posits three trend phases: accumulation, when smart money starts buying or selling; public participation, when the wider public joins in; and distribution, when the smart money exits.
There are a number of ways to trade the DJIA. One is to use ETFs which allow investors to trade the DJIA as a single security, rather than having to buy shares in all 30 constituent companies. A leading example is the SPDR Dow Jones Industrial Average ETF (DIA). DJIA futures contracts enable traders to speculate on the future value of the index and Options provide the right, but not the obligation, to buy or sell the index at a predetermined price in the future. Mutual funds enable investors to buy a share of a diversified portfolio of DJIA stocks thus providing exposure to the overall index.
Recommended Articles


