

Dow Jones Industrial Average holds steady as markets brush off tariffs
- The Dow Jones is hitting a comfortable midrange around 44,450 on Tuesday.
- Threats of nearly-global tariffs have evaporated over 24 hours.
- Trade tensions remain an issue with China, but tariff breaks are priced in.
The Dow Jones Industrial Average (DJIA) is testing the 44,450 region on Tuesday, with equities slowing their recent pace of volatility as United States (US) President Donald Trump walks back nearly all of his recent trade war blustering and kicks his self-imposed tariff can down the road for a third time. US import tariffs on goods from Mexico and Canada have been delayed for up to 30 days, while planned tariffs on China are still on the table and warnings of tariffs on goods from the European Union are also in the pipe.
Despite all the trade war bluster, the Trump administration's three straight walkbacks have left investors with a strong sense that the tariffs were never meant to be an implemented part of the US’ trade strategy. Instead, they were President Trump’s best efforts to work twice as hard to accomplish half as much, strong-arming some of America’s closest trading partners to the negotiating table and obtaining concessions that were largely already agreed to with the previous US federal administration. Tariff threats are likely to be treated less seriously by markets moving forward as investors focus on material issues.
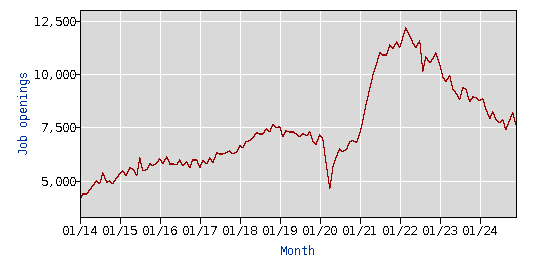
US JOLTS Jobs Openings figures from December printed on Tuesday, showing a slight cooling to 7.6M from 8.09M. JOLTS has an abysmally low respondent rate of around 30%, and December’s print is also a preliminary figure, due for a number of revisions throughout the calendar year. Regardless, the trend in patchy job openings data remains clear as the indicator grinds into two-year lows.
Dow Jones news
Over two-thirds of the Dow Jones equity board is testing into the high side on Tuesday, with investor sentiment brushing off its recent overreaction to trade war gesticulations by the US. Merck & Co tumbled over 10% and fell below $90 per share despite topping Wall Street earnings expectations after the drug supplier softened its forward guidance, warning investors that demand for vaccines in China has not recovered to expected levels and will be pausing further shipments to mainland China to alleviate a supply buildup.
Dow Jones price forecast
A back-and-forth tussle on daily candlesticks has the Dow Jones strung along a near-term midrange, with price action hung up near the 44,500 level. Bids found a technical floor near the 44,000 major price handle this week, but topside momentum remains thin as investors struggle to climb over 45,000. A further cooling period may be required as technical oscillators churn in overbought territory.
Dow Jones daily chart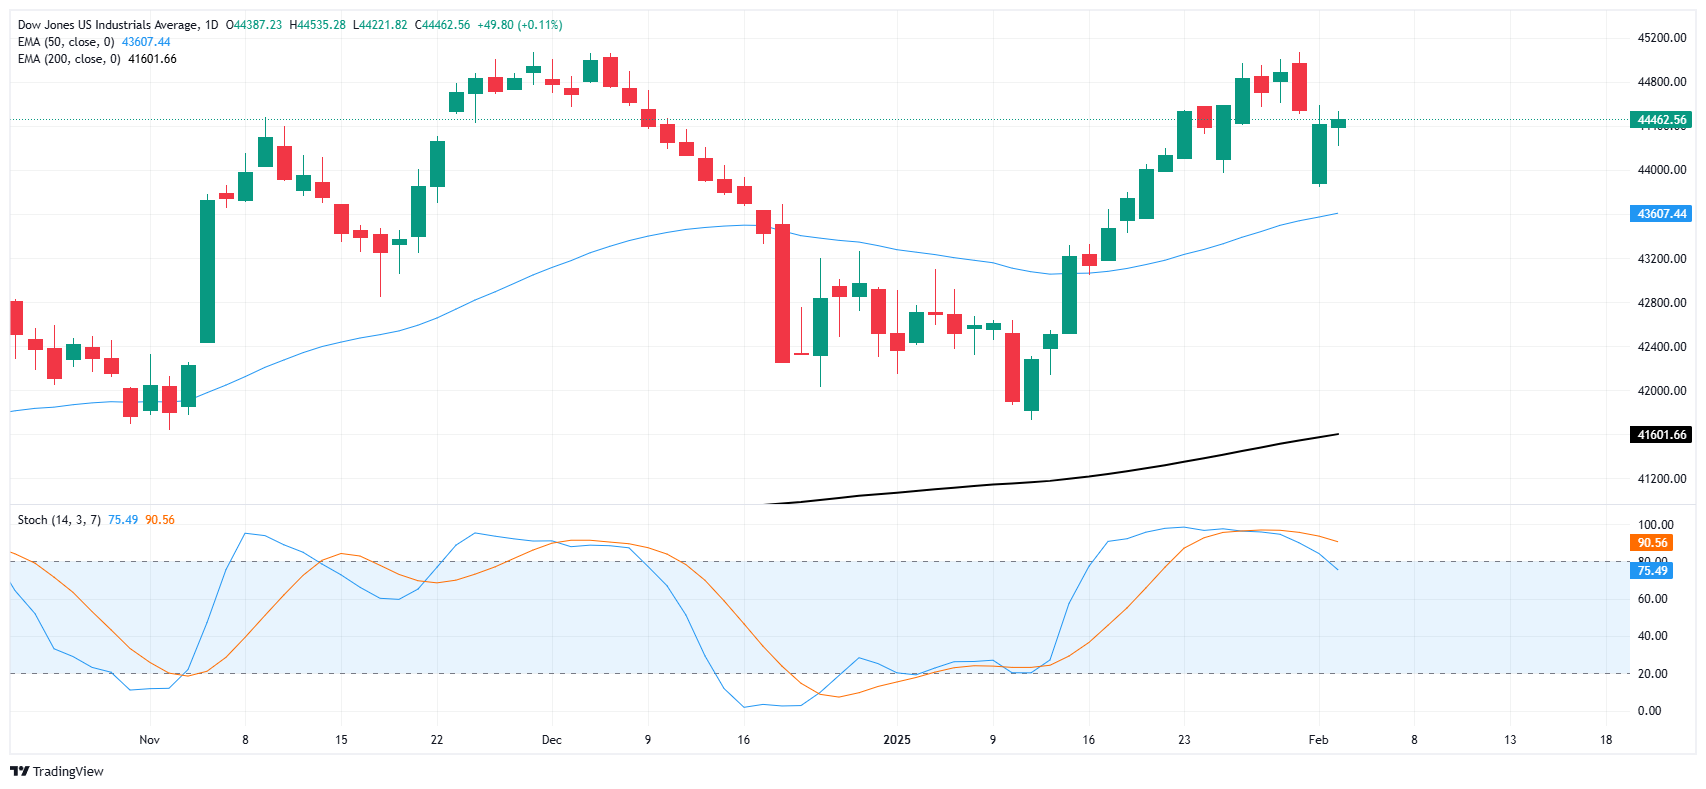
Dow Jones FAQs
The Dow Jones Industrial Average, one of the oldest stock market indices in the world, is compiled of the 30 most traded stocks in the US. The index is price-weighted rather than weighted by capitalization. It is calculated by summing the prices of the constituent stocks and dividing them by a factor, currently 0.152. The index was founded by Charles Dow, who also founded the Wall Street Journal. In later years it has been criticized for not being broadly representative enough because it only tracks 30 conglomerates, unlike broader indices such as the S&P 500.
Many different factors drive the Dow Jones Industrial Average (DJIA). The aggregate performance of the component companies revealed in quarterly company earnings reports is the main one. US and global macroeconomic data also contributes as it impacts on investor sentiment. The level of interest rates, set by the Federal Reserve (Fed), also influences the DJIA as it affects the cost of credit, on which many corporations are heavily reliant. Therefore, inflation can be a major driver as well as other metrics which impact the Fed decisions.
Dow Theory is a method for identifying the primary trend of the stock market developed by Charles Dow. A key step is to compare the direction of the Dow Jones Industrial Average (DJIA) and the Dow Jones Transportation Average (DJTA) and only follow trends where both are moving in the same direction. Volume is a confirmatory criteria. The theory uses elements of peak and trough analysis. Dow’s theory posits three trend phases: accumulation, when smart money starts buying or selling; public participation, when the wider public joins in; and distribution, when the smart money exits.
There are a number of ways to trade the DJIA. One is to use ETFs which allow investors to trade the DJIA as a single security, rather than having to buy shares in all 30 constituent companies. A leading example is the SPDR Dow Jones Industrial Average ETF (DIA). DJIA futures contracts enable traders to speculate on the future value of the index and Options provide the right, but not the obligation, to buy or sell the index at a predetermined price in the future. Mutual funds enable investors to buy a share of a diversified portfolio of DJIA stocks thus providing exposure to the overall index.
Recommended Articles


