


US Dollar trades steady while markets await NFP report
- The US Dollar trades flat against most major peers.
- Inflation woes stepped aside while traders focus on the upcoming Employment Report.
- The US Dollar Index (DXY) steadies around 109.00 and is set for some volatility later this Friday.
The US Dollar Index (DXY), which tracks the Greenback’s value against six major currencies, is trading steady this Friday, at 109.17 at the time of writing, ahead of the US employment report due later. Markets are leaving aside for a few hours inflation woes, which were the main theme throughout this week. Those concerns are moving now to the background while Asian equities are set to close off this week with a five-day losing streak.
The US economic calendar is quite interesting on Friday, with the December Nonfarm Payrolls (NFP) release and the January University of Michigan preliminary reading. Expectations for the NFP reading range from 100,000 e to 268,000. Expect any print below 100,000 to trigger substantial US Dollar (USD) weakness, while a print near or above 268,000 will trigger more US Dollar strength.
Daily digest market movers: Last employment report for Biden
- At 13:30 GMT, the US employment report for December will be released with the following main key elements:
- Nonfarm Payrolls headline data is expected to show 160,000 new workers against the 227,000 in November.
- The Unemployment Rate is expected to remain stable at 4.2%.
- The monthly Average Hourly Earnings are expected to ease a touch to 0.3% in December from the previous 0.4%.
- At 15:00 GMT, the University of Michigan releases its January preliminary reading:
- The Consumer Sentiment Index is expected to remain elevated at 73.8, just a bit lower from the previous 74.0.
- The 5-year Consumer Inflation Expectation print has no forecast and was at 3% in the final December reading.
- Equities look sluggish this Friday, with the Asian ones set to end the week with a negative daily close for China or Japan.
- The CME FedWatch Tool is projecting a 93.1% chance that interest rates will be kept unchanged at current levels in the January meeting. Expectations are for the Federal Reserve (Fed) to remain data-dependent with uncertainties that could influence the inflation path once President-elect Donald Trump takes office on January 20.
- US yields are softening a touch with the 10-year benchmark at 4.689%, off the fresh nine -month high at 4.728% seen on Wednesday.
US Dollar Index Technical Analysis: Ten more days
The US Dollar Index (DXY) is entering its last ten days of trading under President Joe Biden before President-elect Donald Trump’s inauguration on January 20. The question will be how much downside there is, given the general consensus that Trump’s policies will be inflationary and drive the US Dollar higher. Expect buyers to come in and quickly push the DXY back up, even with a weaker Nonfarm Payrolls release.
On the upside, it is key that the green ascending trend line can hold as support, although that is often not the scenario going forward. If the DXY can head and break above the 110.00 psychological barrier, 110.79 becomes the next big level. Once beyond there, it is quite a stretch to 113.91, the double top from November 2023.
On the contrary, the first downside barrier is 107.35, which has now turned into support. The next level that might halt any selling pressure is 106.52, with the 55-day Simple Moving Average (SMA) at 106.72 reinforcing this region of support.
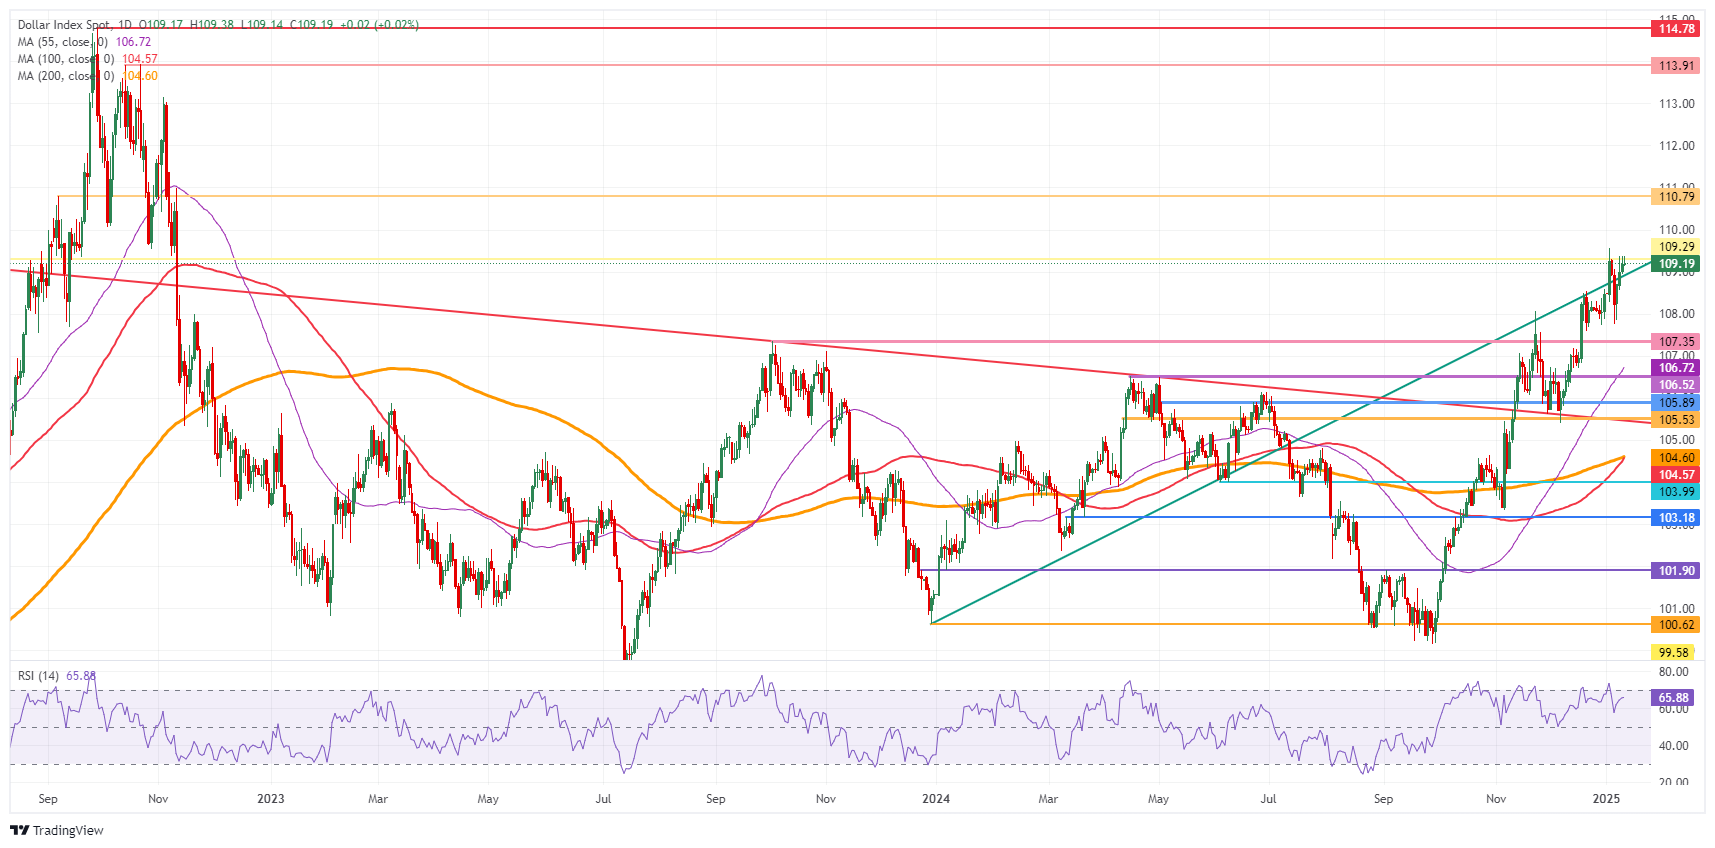
US Dollar Index: Daily Chart
US Dollar FAQs
The US Dollar (USD) is the official currency of the United States of America, and the ‘de facto’ currency of a significant number of other countries where it is found in circulation alongside local notes. It is the most heavily traded currency in the world, accounting for over 88% of all global foreign exchange turnover, or an average of $6.6 trillion in transactions per day, according to data from 2022. Following the second world war, the USD took over from the British Pound as the world’s reserve currency. For most of its history, the US Dollar was backed by Gold, until the Bretton Woods Agreement in 1971 when the Gold Standard went away.
The most important single factor impacting on the value of the US Dollar is monetary policy, which is shaped by the Federal Reserve (Fed). The Fed has two mandates: to achieve price stability (control inflation) and foster full employment. Its primary tool to achieve these two goals is by adjusting interest rates. When prices are rising too quickly and inflation is above the Fed’s 2% target, the Fed will raise rates, which helps the USD value. When inflation falls below 2% or the Unemployment Rate is too high, the Fed may lower interest rates, which weighs on the Greenback.
In extreme situations, the Federal Reserve can also print more Dollars and enact quantitative easing (QE). QE is the process by which the Fed substantially increases the flow of credit in a stuck financial system. It is a non-standard policy measure used when credit has dried up because banks will not lend to each other (out of the fear of counterparty default). It is a last resort when simply lowering interest rates is unlikely to achieve the necessary result. It was the Fed’s weapon of choice to combat the credit crunch that occurred during the Great Financial Crisis in 2008. It involves the Fed printing more Dollars and using them to buy US government bonds predominantly from financial institutions. QE usually leads to a weaker US Dollar.
Quantitative tightening (QT) is the reverse process whereby the Federal Reserve stops buying bonds from financial institutions and does not reinvest the principal from the bonds it holds maturing in new purchases. It is usually positive for the US Dollar.
Recommended Articles


