


Dow Jones Industrial Average softens as jobs data withers
- The Dow Jones fell 150 points on Wednesday after US jobs figures missed the mark.
- ADP hiring data slowed more than expected, and wage growth shrank to a two-year low.
- Investors await the Fed’s latest Meeting Minutes from December’s rate cut assessment.
The Dow Jones Industrial Average (DJIA) ground its way lower once again on Wednesday. The index backslid a choppy 150 points after equities turned tepid on the back of a misfire in preview jobs data ahead of this week’s key Nonfarm Payrolls (NFP) report.
ADP Employment Change showed a slower pace of hiring than markets expected in December, easing to 122K versus the expected 140K and November’s 146K. ADP wage data also pumped the brakes and hit its slowest pace since mid-2021.
The key print on Wednesday will be the Federal Reserve’s (Fed) latest Meeting Minutes from the December rate call. The Fed trimmed interest rates one final time by 25 bps to wrap up 2024, but now it looks set to hold off on any further rate cuts until the midpoint of 2025 as the US economy chugs along. Policy concerns about incoming President Donald Trump weigh on policymakers, even as they insist they don’t.
US markets will close early on Thursday, so traders should expect a tightening in market volumes during the American trading window. US operations are winding down in observance of the passing of former US President Jimmy Carter, who died in late December at the age of 100.
Dow Jones news
Equities listed on the Dow Jones were split roughly down the middle on Wednesday, but concentrated losses in key stocks are dragging the average to the low side. Johnson & Johnson (JNJ) tumbled to a new yearly low despite reaching ‘Fast Track’ status with the Food & Drug Administration for several of its new pharmaceutical offerings. JNJ is now down around 3% on the day and pushing below $142 per share.
Dow Jones price forecast
The Dow Jones’ bearish tilt, which began in late November, continues to weigh on the major equity index. The DJIA is on pace to close in the red for a sixth consecutive week and remains down nearly 6% from its all-time peak of 45,071 in November. Of the last 19 consecutive trading days, the Dow Jones has closed flat or in the red for all but three of them, including a record-setting run of 11 straight bearish sessions.
Despite a near-term bearish swing, downside momentum still faces significant headwinds. The DJIA is still trading north of the 200-day Exponential Moving Average (EMA) near 41,200, and bidders are still trying to get their feet under them and muscle price action back above the 50-day EMA near 43,150.
Dow Jones daily chart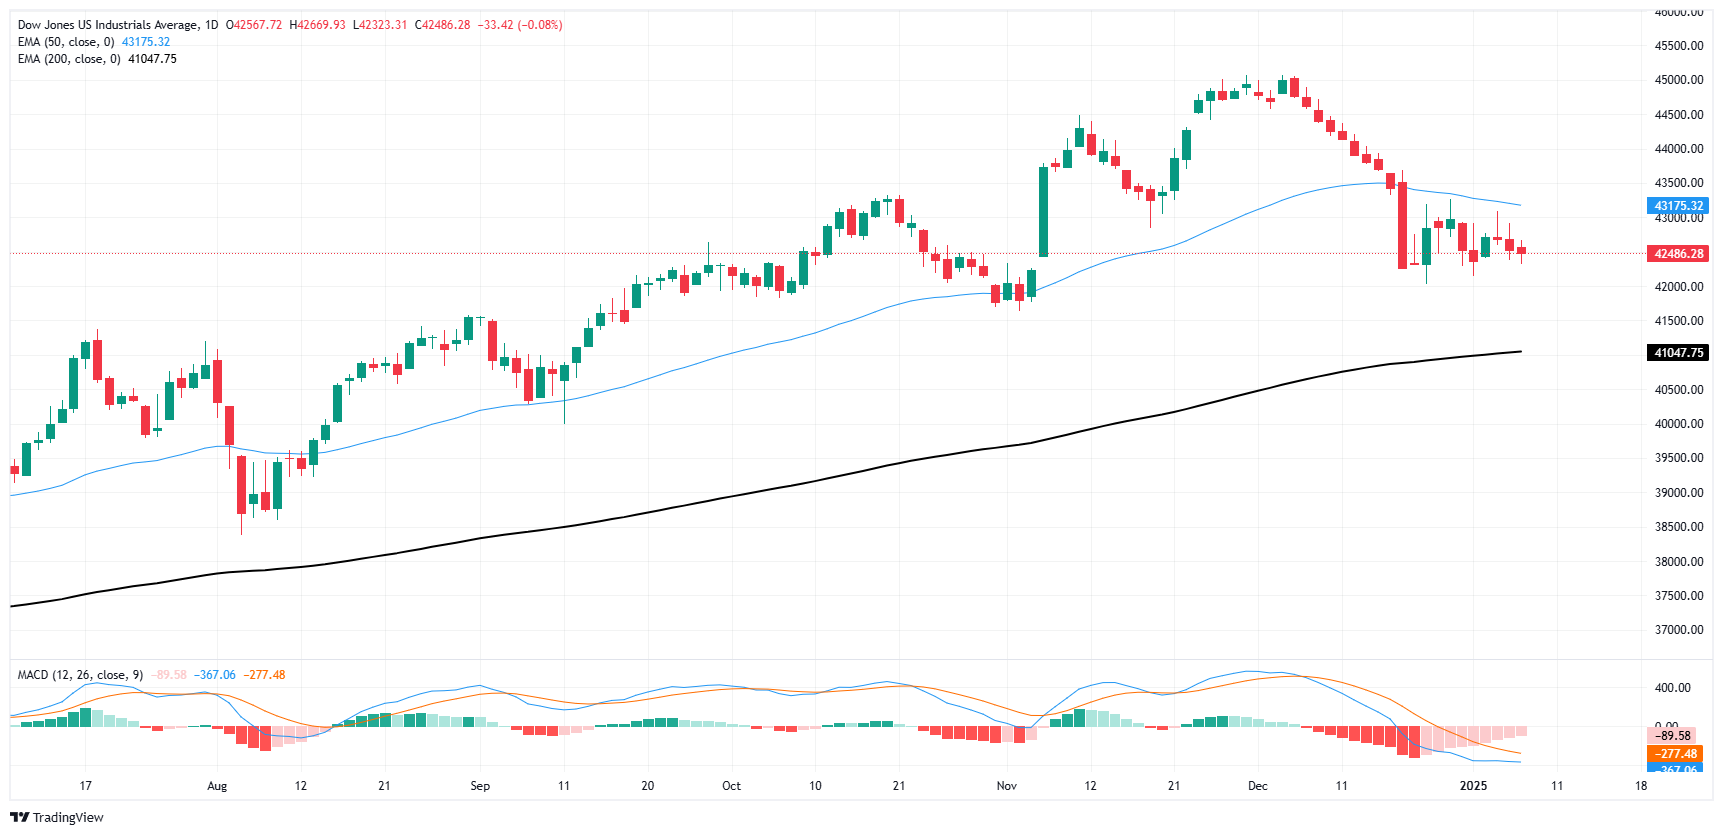
Dow Jones FAQs
The Dow Jones Industrial Average, one of the oldest stock market indices in the world, is compiled of the 30 most traded stocks in the US. The index is price-weighted rather than weighted by capitalization. It is calculated by summing the prices of the constituent stocks and dividing them by a factor, currently 0.152. The index was founded by Charles Dow, who also founded the Wall Street Journal. In later years it has been criticized for not being broadly representative enough because it only tracks 30 conglomerates, unlike broader indices such as the S&P 500.
Many different factors drive the Dow Jones Industrial Average (DJIA). The aggregate performance of the component companies revealed in quarterly company earnings reports is the main one. US and global macroeconomic data also contributes as it impacts on investor sentiment. The level of interest rates, set by the Federal Reserve (Fed), also influences the DJIA as it affects the cost of credit, on which many corporations are heavily reliant. Therefore, inflation can be a major driver as well as other metrics which impact the Fed decisions.
Dow Theory is a method for identifying the primary trend of the stock market developed by Charles Dow. A key step is to compare the direction of the Dow Jones Industrial Average (DJIA) and the Dow Jones Transportation Average (DJTA) and only follow trends where both are moving in the same direction. Volume is a confirmatory criteria. The theory uses elements of peak and trough analysis. Dow’s theory posits three trend phases: accumulation, when smart money starts buying or selling; public participation, when the wider public joins in; and distribution, when the smart money exits.
There are a number of ways to trade the DJIA. One is to use ETFs which allow investors to trade the DJIA as a single security, rather than having to buy shares in all 30 constituent companies. A leading example is the SPDR Dow Jones Industrial Average ETF (DIA). DJIA futures contracts enable traders to speculate on the future value of the index and Options provide the right, but not the obligation, to buy or sell the index at a predetermined price in the future. Mutual funds enable investors to buy a share of a diversified portfolio of DJIA stocks thus providing exposure to the overall index.
Recommended Articles


