

Dow Jones Industrial Average trims gains on Tuesday
- The Dow Jones is taking a breather as bids hold just above 44,000.
- Post-election rally pauses, but with little retracement on the cards.
- US CPI inflation data due Wednesday to drive momentum.
The Dow Jones Industrial Average shed a scant 200 points on Tuesday, marking out territory just north of the 44,000 handle as equities take a brief pause from the post-election rally that sent the Dow Jones into fresh record highs. The major equity index surged above 44,000 last week after former President Donald Trump appeared to sweep to a stunning election win, sending investors into a frenzy as they bought whatever they could find.
Now that the Dow Jones is up over 18% in 2024 alone, the post-election glut is taking a pause as investors weigh wether or not equities are encroaching on oversold territory. The DJIA is on pace to chalk in its strongest month since November of last year, when the equity board added nearly 9% in a four-week period. The Dow Jones is now up over 5.5% this November, and one-sided equity traders are taking a breather as US Consumer Price Index (CPI) inflation figures loom around the corner.
US CPI inflation figures for the month of October are slated to release on Wednesday, and markets are expecting a rebound in annualized headline consumer price growth. Full-fat CPI inflation is forecast to tick higher to 2.6% YoY compared to September’s print of 2.4%. Core CPI inflation is expected to hold steady at 3.3% YoY. The monthly figure for both inflation categories are broadly expected to hold flat month-on-month.
Dow Jones news
Tuesday’s pause in the broad-market rally has roughly two-thirds of the Dow Jones testing into the red on the day. Losses were led by 3M (MMM) and Boeing (BA), each falling a little under 3% from the day’s opening prices. 3M eased below $130 per share, while Boeing slipped back underneath $145 per share.
On the high side, Honeywell International (HON) rose nearly 3% and climbed over $231.50 per share. This week, it was revealed that activist investment holdings firm Elliott Management has taken a significant stake in Honeywell, bolstering market confidence in the tech company’s outlook.
Elliott Management has submitted a letter to Honeywell’s board proposing a major restructuring of the company. They suggest that Honeywell should split into two independent entities. Elliott believes that this separation could increase Honeywell's share price by 51% to 75% over the next two years.
Dow Jones price forecast
Thin losses on Tuesday have crimped the Dow Jones’ mostly one-sided November chart action, though the major equity index is still holding onto bullish territory north of 44,000. Early November sparked a bullish extension after price action gave a clean bounce off of the 50-day Exponential Moving Average (EMA) back when bids and the key moving average mixed near the 42,000 handle.
Dow Jones daily chart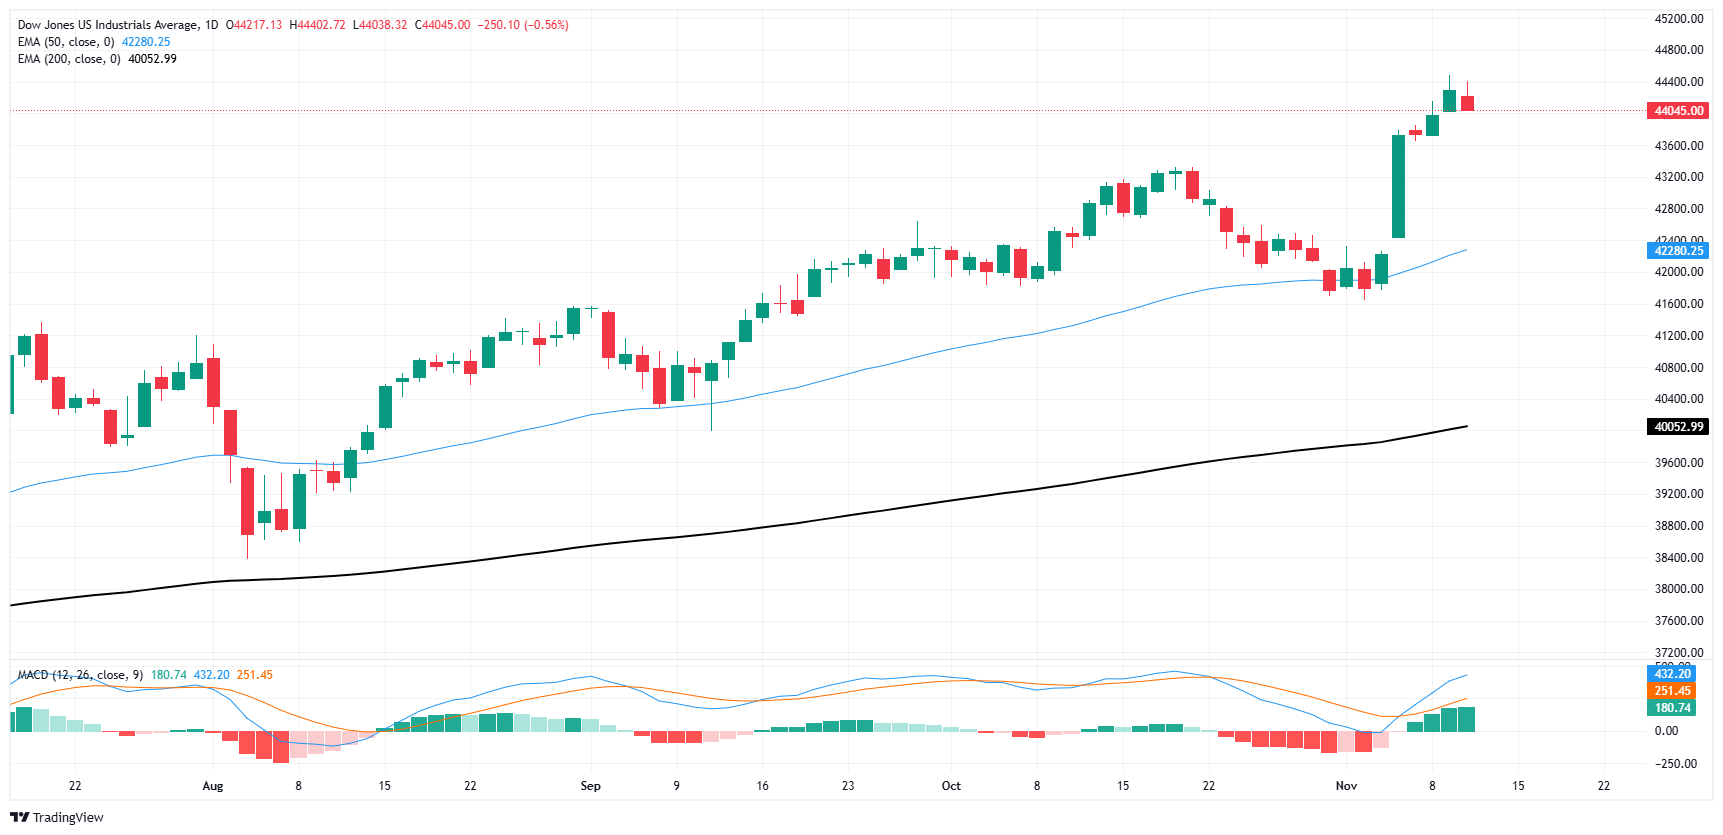
Dow Jones FAQs
The Dow Jones Industrial Average, one of the oldest stock market indices in the world, is compiled of the 30 most traded stocks in the US. The index is price-weighted rather than weighted by capitalization. It is calculated by summing the prices of the constituent stocks and dividing them by a factor, currently 0.152. The index was founded by Charles Dow, who also founded the Wall Street Journal. In later years it has been criticized for not being broadly representative enough because it only tracks 30 conglomerates, unlike broader indices such as the S&P 500.
Many different factors drive the Dow Jones Industrial Average (DJIA). The aggregate performance of the component companies revealed in quarterly company earnings reports is the main one. US and global macroeconomic data also contributes as it impacts on investor sentiment. The level of interest rates, set by the Federal Reserve (Fed), also influences the DJIA as it affects the cost of credit, on which many corporations are heavily reliant. Therefore, inflation can be a major driver as well as other metrics which impact the Fed decisions.
Dow Theory is a method for identifying the primary trend of the stock market developed by Charles Dow. A key step is to compare the direction of the Dow Jones Industrial Average (DJIA) and the Dow Jones Transportation Average (DJTA) and only follow trends where both are moving in the same direction. Volume is a confirmatory criteria. The theory uses elements of peak and trough analysis. Dow’s theory posits three trend phases: accumulation, when smart money starts buying or selling; public participation, when the wider public joins in; and distribution, when the smart money exits.
There are a number of ways to trade the DJIA. One is to use ETFs which allow investors to trade the DJIA as a single security, rather than having to buy shares in all 30 constituent companies. A leading example is the SPDR Dow Jones Industrial Average ETF (DIA). DJIA futures contracts enable traders to speculate on the future value of the index and Options provide the right, but not the obligation, to buy or sell the index at a predetermined price in the future. Mutual funds enable investors to buy a share of a diversified portfolio of DJIA stocks thus providing exposure to the overall index.
Recommended Articles


