

US Dollar holds gains as Fed speakers stand out in soft start of t...
- The US Dollar trades slightly up with Columbus Day keeping the bond market closed in the US.
- The economic calendar ahead for this week is light.
- The US Dollar Index orbits around 103.00 and could still move either way.
The US Dollar (USD) edges up slightly at the start of the week with several parts of the US markets closed for Columbus Day. Despite the bank holiday, three Federal Reserve (Fed) members are due to speak. Meanwhile, the additional stimulus package from the Chinese government did not trigger any big moves in markets.
The economic calendar is thus empty due to the Columbus Day bank holiday in the US. About Fedspeak, traders will need to watch out for comments from Federal Reserve Governor Christopher Waller, who has a track record of leaving market-moving comments.
Daily digest market movers: A very light calendar ahead
- Due to Columbus Day, the bond market is closed in the US. Equity Futures markets are open and trading.
- At 13:00 GMT, Federal Reserve Bank of Minneapolis President Neel Kashkari participates in a panel discussion about fiscal deficits, monetary policy and inflation at the Central Bank of Argentina's Money and Banking Conference in Buenos Aires. Later at 21:00 GMT, Kashkari will speak again about the current state of the US economy at the Department of Economics of Torcuato di Tella University.
- Around 19:00 GMT, Federal Reserve Governor Christopher Waller speaks about the US economic outlook at a conference titled "A 50-Year Retrospective on the Shadow Open Market Committee and Its Role in Monetary Policy" in Stanford, California.
- Equities are looking for direction this Monday with no real outliers to report. Europe is trading marginally in the green, while US futures are flat.
- The CME Fed rate policy expectation for the meeting on November 7 stands at 88.2% for a 25 basis point rate cut, while 11.8% is pricing in no rate cut. Chances for a 50 bps rate cut have been fully priced out.
- The US 10-year benchmark rate is not trading this Monday and closed on Friday at 4.10%.
US Dollar Index Technical Analysis: Pivotal moment this week
The US Dollar Index (DXY) is orbiting around 103.00 and looking for a chance to go higher. The question on the table is whether, with a very light US calendar this week, there will be any catalyst big enough to elevate the DXY to the next level. If the Fed speakers can not do it on Monday, it looks questionable if the US Dollar Index will be able to advance any further for now.
The psychological 103.00 is the first level to tackle on the upside. Further up, the chart identifies 103.18 as the very final resistance level for this week. Once above there, a very choppy area emerges, with the 100-day Simple Moving Average (SMA) at 103.24, the 200-day SMA at 103.77, and the pivotal 103.99-104.00 levels in play.
On the downside, the 55-day SMA at 101.88 is the first line of defence, backed by the 102.00 round level and the pivotal 101.90 as support to catch any bearish pressure and trigger a bounce. If that level does not work out, 100.62 also acts as support. Further down, a test of the year-to-date low of 100.16 should take place before more downside. Finally, and that means giving up the big 100.00 level, the July 14, 2023, low at 99.58 comes into play.
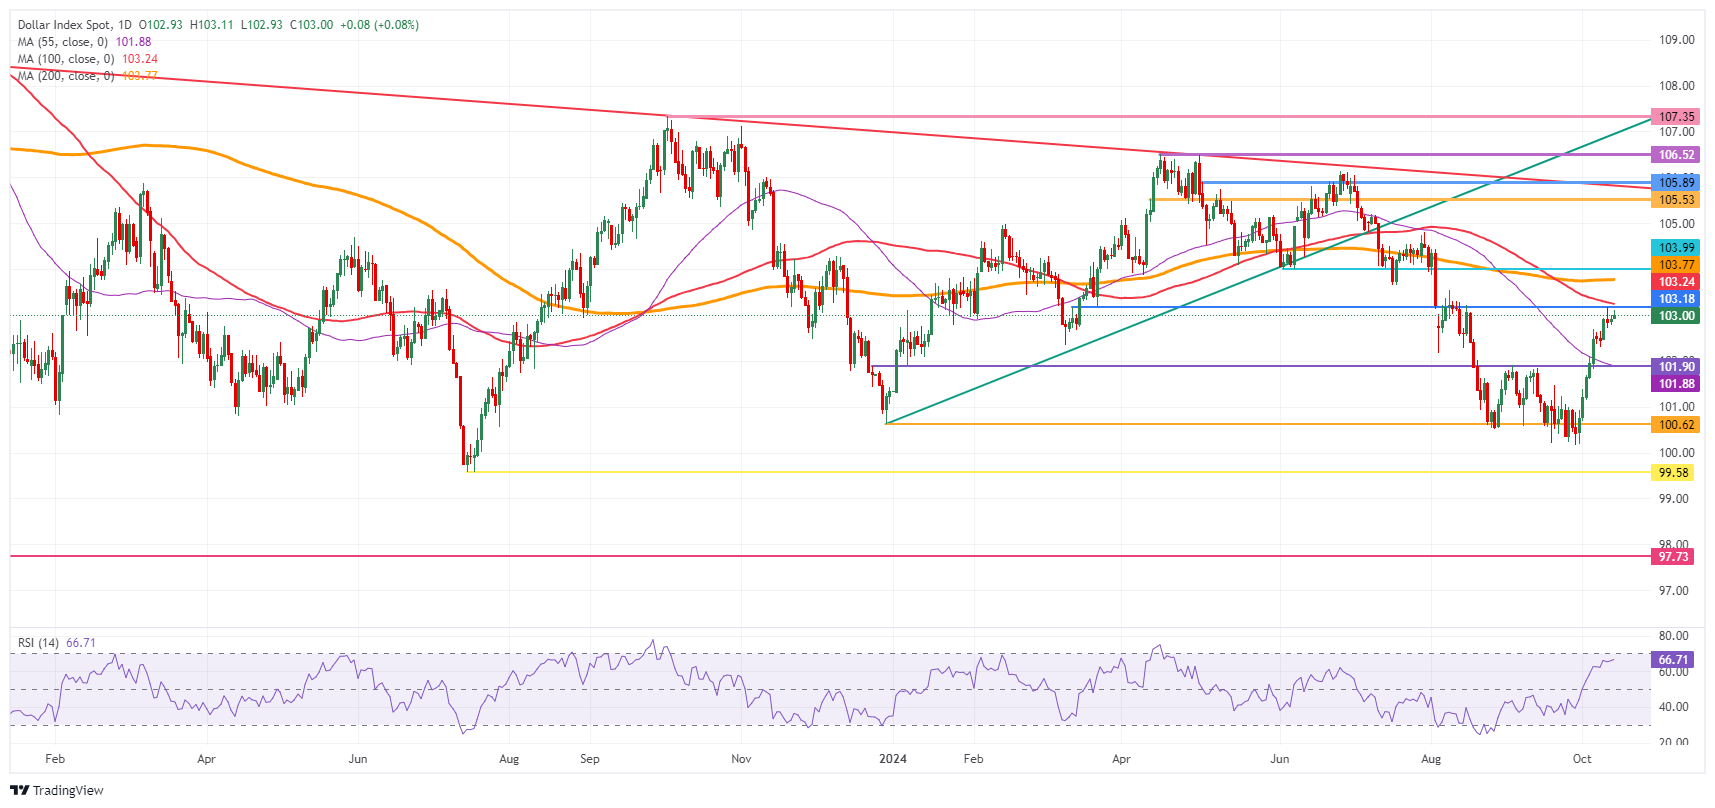
US Dollar Index: Daily Chart
US Dollar FAQs
The US Dollar (USD) is the official currency of the United States of America, and the ‘de facto’ currency of a significant number of other countries where it is found in circulation alongside local notes. It is the most heavily traded currency in the world, accounting for over 88% of all global foreign exchange turnover, or an average of $6.6 trillion in transactions per day, according to data from 2022. Following the second world war, the USD took over from the British Pound as the world’s reserve currency. For most of its history, the US Dollar was backed by Gold, until the Bretton Woods Agreement in 1971 when the Gold Standard went away.
The most important single factor impacting on the value of the US Dollar is monetary policy, which is shaped by the Federal Reserve (Fed). The Fed has two mandates: to achieve price stability (control inflation) and foster full employment. Its primary tool to achieve these two goals is by adjusting interest rates. When prices are rising too quickly and inflation is above the Fed’s 2% target, the Fed will raise rates, which helps the USD value. When inflation falls below 2% or the Unemployment Rate is too high, the Fed may lower interest rates, which weighs on the Greenback.
In extreme situations, the Federal Reserve can also print more Dollars and enact quantitative easing (QE). QE is the process by which the Fed substantially increases the flow of credit in a stuck financial system. It is a non-standard policy measure used when credit has dried up because banks will not lend to each other (out of the fear of counterparty default). It is a last resort when simply lowering interest rates is unlikely to achieve the necessary result. It was the Fed’s weapon of choice to combat the credit crunch that occurred during the Great Financial Crisis in 2008. It involves the Fed printing more Dollars and using them to buy US government bonds predominantly from financial institutions. QE usually leads to a weaker US Dollar.
Quantitative tightening (QT) is the reverse process whereby the Federal Reserve stops buying bonds from financial institutions and does not reinvest the principal from the bonds it holds maturing in new purchases. It is usually positive for the US Dollar.
Recommended Articles


