


Dow Jones Industrial Average lurches higher post-NFP
- The Dow Jones recovered ground on NFP Friday, but still remains down on the week..
- The US added far more jobs than expected in September.
- Market hopes for a follow-up jumbo cut from the Fed have collapsed.
The Dow Jones Industrial Average (DJIA) rallied after US Nonfarm Payrolls (NFP) jobs figures blew past expectations. US NFP net job gains soared to 254K on Friday, cudgeling market hopes for a second double-wide rate cut from the Federal Reserve (Fed) on November 7.
The US Unemployment Rate dropped back to 4.1% from the previous 4.2%, further reinforcing a healthier-than-expected landscape in the US labor market. In addition, several months’ worth of NFP releases saw healthy upside revisions. August’s previous NFP total was lifted by an additional 17K, while July’s figure rose sharply by 55K, bringing the total up to 144K.
Annual wage growth also firmed up in September, rising 4.0% YoY from the previous 3.9%. Investors had expected September’s Average Hourly Earnings growth to ease back to 3.8%. With wages and net jobs additions blowing well past expectations across the board, rate market expectations of a higher pace of rate cuts have taken a huge hit to round out a middling-at-best trading week.
According to the CME’s FedWatch Tool, rate trader expectations for the Fed’s November rate call plummeted post-NFP; rate futures speculators now see a 95% chance that the Fed will trim rates by a modest 25 bps on November 7, with the last 5% betting on no movement at all on the Fed funds rate.
Dow Jones news
Despite a moderate recovery after a bumper NFP print, the Dow Jones only saw a tempered rally. The index broadly rallied on reaction to US jobs figures, rising nearly 400 points bottom-to-top, but the index has settled to a more reasonable 200-point gain.
Two-thirds of the Dow Jones’ constituent securities rose on Friday, led by JPMorgan Chase (JPM). JPMorgan rallied 3% on the day, climbing over $210 per share. On the low side, Home Depot (HD) backslid 1% to $407 per share.
In other stock news, Amazon (AMZN) rose nearly 2% on Friday, clipping into $185 per share on the back of upbeat jobs data and the rapid resolution of the East Coast dock worker’s strike.
Dow Jones price forecast
The Dow Jones is on an upward trajectory overall, nearing a crucial resistance level while technical indicators suggest positive momentum in the market. The index is currently hovering around 42,200, a point at which it has previously encountered selling pressure. traders are watching to see whether the Dow can surpass this resistance, a move that could open the door to further advances in the short term.
Despite the overall positive trend, recent price movements reflect uncertainty. Daily candles have been switching between bullish and bearish, indicating that the market is taking a pause as it tests the resistance level.
"We are currently at a critical juncture in the market. A clean breakout above this resistance might generate renewed buying interest," remarked one technical analyst. "However, if the Dow fails to overcome this level, we may witness a retreat toward the moving averages."
Dow Jones daily chart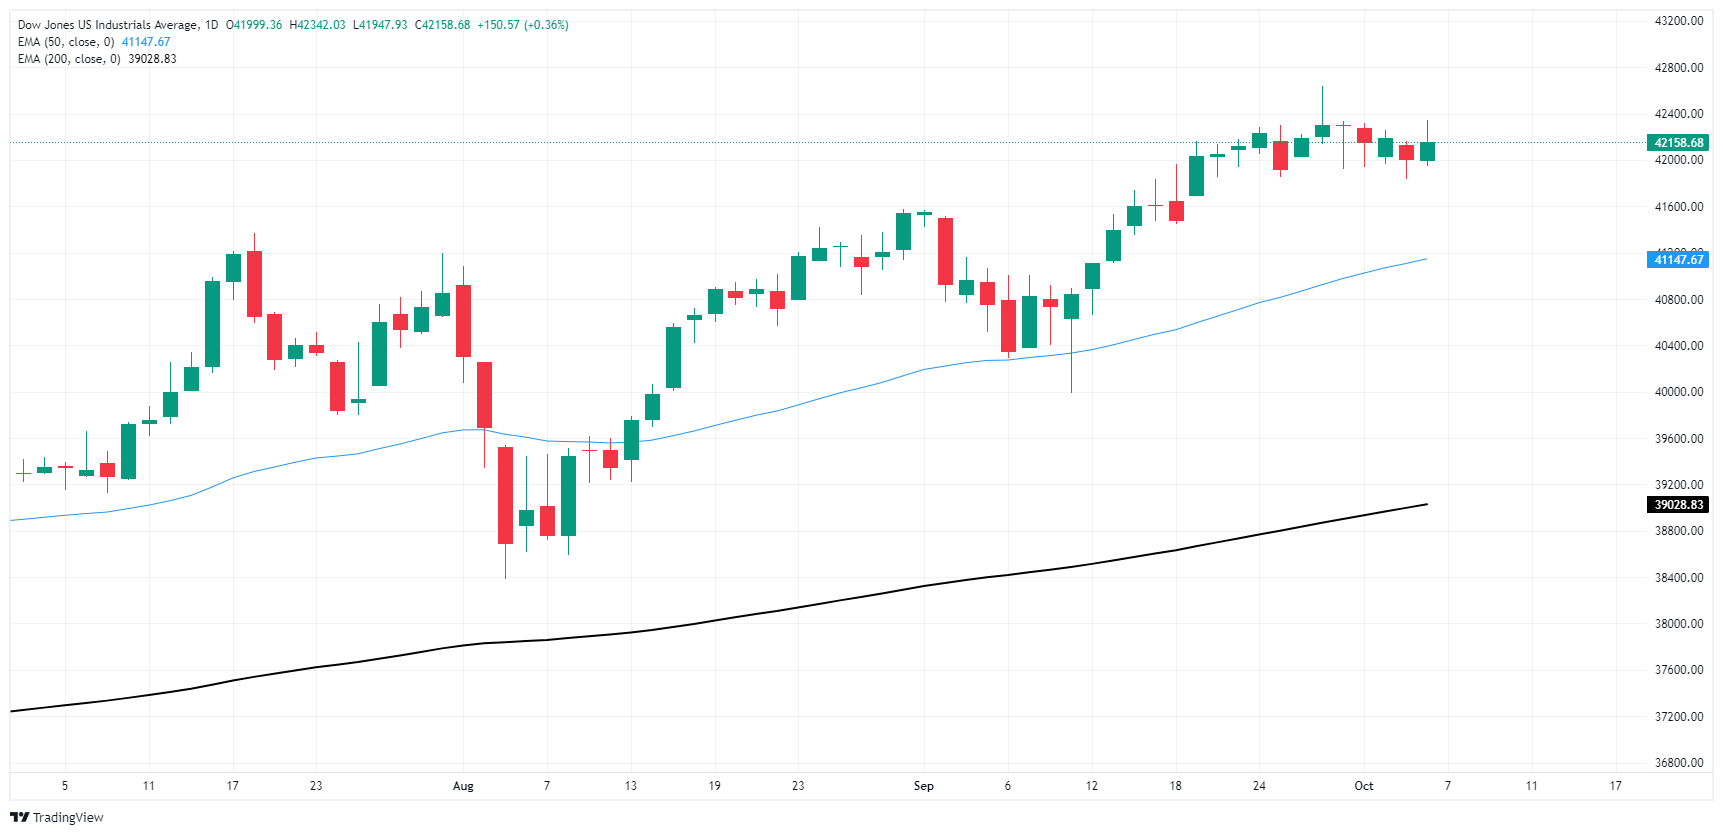
Dow Jones FAQs
The Dow Jones Industrial Average, one of the oldest stock market indices in the world, is compiled of the 30 most traded stocks in the US. The index is price-weighted rather than weighted by capitalization. It is calculated by summing the prices of the constituent stocks and dividing them by a factor, currently 0.152. The index was founded by Charles Dow, who also founded the Wall Street Journal. In later years it has been criticized for not being broadly representative enough because it only tracks 30 conglomerates, unlike broader indices such as the S&P 500.
Many different factors drive the Dow Jones Industrial Average (DJIA). The aggregate performance of the component companies revealed in quarterly company earnings reports is the main one. US and global macroeconomic data also contributes as it impacts on investor sentiment. The level of interest rates, set by the Federal Reserve (Fed), also influences the DJIA as it affects the cost of credit, on which many corporations are heavily reliant. Therefore, inflation can be a major driver as well as other metrics which impact the Fed decisions.
Dow Theory is a method for identifying the primary trend of the stock market developed by Charles Dow. A key step is to compare the direction of the Dow Jones Industrial Average (DJIA) and the Dow Jones Transportation Average (DJTA) and only follow trends where both are moving in the same direction. Volume is a confirmatory criteria. The theory uses elements of peak and trough analysis. Dow’s theory posits three trend phases: accumulation, when smart money starts buying or selling; public participation, when the wider public joins in; and distribution, when the smart money exits.
There are a number of ways to trade the DJIA. One is to use ETFs which allow investors to trade the DJIA as a single security, rather than having to buy shares in all 30 constituent companies. A leading example is the SPDR Dow Jones Industrial Average ETF (DIA). DJIA futures contracts enable traders to speculate on the future value of the index and Options provide the right, but not the obligation, to buy or sell the index at a predetermined price in the future. Mutual funds enable investors to buy a share of a diversified portfolio of DJIA stocks thus providing exposure to the overall index.
Recommended Articles


