

Dow Jones Industrial Average climbs into another record high
- The Dow Jones broke above 42,000 to set a third straight all-time high on Thursday.
- Equities are firmly bullish after the Fed’s long-awaited rate cut this week.
- The Fed’s jumbo 50 bps on Wednesday has paved the way for further cuts this year.
The Dow Jones Industrial Average (DJIA) pierced the 42,000 psychological level on Thursday as equities drove higher in a broad-market bull run after the Federal Reserve (Fed) finally delivered its first rate cut in over four years. Equities have gone full-tilt into a risk-on stance, and the Dow Jones is on pace to close up nearly 600 points in record territory.
On the data side, US Initial Jobless Claims eased back to 219K for the week ended September 13, down from the previous week’s revised 231K and under the median market forecast of 230K. The Philadelphia Fed Manufacturing Survey for September also printed well above expectations, with the spread index of manufacturing conditions improving to 1.7 from the previous seven-month low of -7.0 and handily beating the expected print of -1.0.
Fed Chair Jerome Powell convinced markets that the Fed’s outsized jumbo cut of 50 bps this week wasn’t a snap response to deteriorating economic conditions but rather an attempt to get ahead of the curve and bolster the US labor market. Powell successfully floated a rebranding of an entire half-percentage-point cut as a “recalibration,” and investors rewarded the Fed’s latest narrative pivot by plowing cash into equities across the board.
Dow Jones news
Despite some securities stuck stubbornly in the red, most of the Dow Jones board is deep in the green on Thursday. Salesforce (CRM) and Caterpillar (CAT) have climbed over 5% from the morning’s open, tapping $266 and $373 per share, respectively. Salesforce is on the rise despite an announcement that Disney (DIS) would be ceasing their use of Salesforce-owned Slack as a company communication product after a security exploit allowed a hacking entity to capture and leak a terabyte of company information.
Dow Jones price forecast
With Dow Jones climbing around 600 points at its highest on Thursday, the major equity index is on pace to capture yet another record close as price action digs in north of 42,000. The Dow Jones’ stellar 2024 performance is continuing unabated, with the stock board set to close in the green for a fifth straight month.
Buyer exhaustion continues to threaten intraday positions built up from the midweek pullback into 41,500. However, any real threat would first require enough short pressure to get baked into the chart, a difficult proposition with current prices facing no technical resistance and the Dow Jones trading a blistering 8% above the long-term 200-day Exponential Moving Average (EMA) at 38,656.
Dow Jones daily chart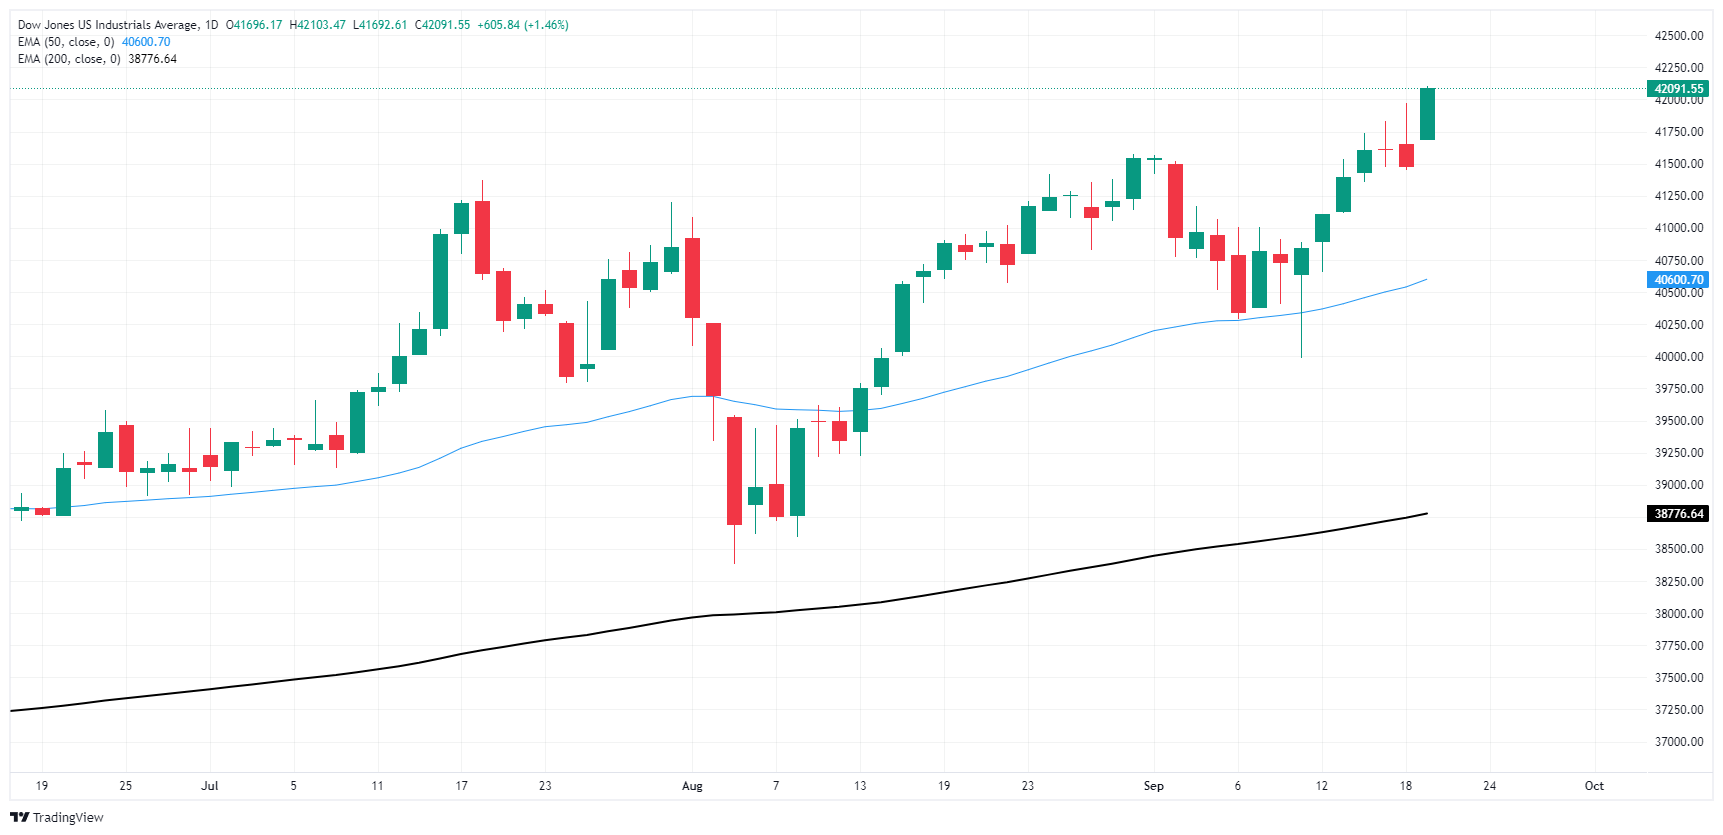
Dow Jones FAQs
The Dow Jones Industrial Average, one of the oldest stock market indices in the world, is compiled of the 30 most traded stocks in the US. The index is price-weighted rather than weighted by capitalization. It is calculated by summing the prices of the constituent stocks and dividing them by a factor, currently 0.152. The index was founded by Charles Dow, who also founded the Wall Street Journal. In later years it has been criticized for not being broadly representative enough because it only tracks 30 conglomerates, unlike broader indices such as the S&P 500.
Many different factors drive the Dow Jones Industrial Average (DJIA). The aggregate performance of the component companies revealed in quarterly company earnings reports is the main one. US and global macroeconomic data also contributes as it impacts on investor sentiment. The level of interest rates, set by the Federal Reserve (Fed), also influences the DJIA as it affects the cost of credit, on which many corporations are heavily reliant. Therefore, inflation can be a major driver as well as other metrics which impact the Fed decisions.
Dow Theory is a method for identifying the primary trend of the stock market developed by Charles Dow. A key step is to compare the direction of the Dow Jones Industrial Average (DJIA) and the Dow Jones Transportation Average (DJTA) and only follow trends where both are moving in the same direction. Volume is a confirmatory criteria. The theory uses elements of peak and trough analysis. Dow’s theory posits three trend phases: accumulation, when smart money starts buying or selling; public participation, when the wider public joins in; and distribution, when the smart money exits.
There are a number of ways to trade the DJIA. One is to use ETFs which allow investors to trade the DJIA as a single security, rather than having to buy shares in all 30 constituent companies. A leading example is the SPDR Dow Jones Industrial Average ETF (DIA). DJIA futures contracts enable traders to speculate on the future value of the index and Options provide the right, but not the obligation, to buy or sell the index at a predetermined price in the future. Mutual funds enable investors to buy a share of a diversified portfolio of DJIA stocks thus providing exposure to the overall index.
Recommended Articles


