

Dow Jones Industrial Average finds record high for second straight day
- The Dow Jones clipped into yet another record bid on Tuesday.
- Investors are tilting into the risk-on side ahead of expected Fed rate cut.
- Markets are split on the depth of anticipated first Fed rate cut in over four years.
The Dow Jones Industrial Average (DJIA) rose into a fresh record high for the second day in a row on Tuesday as investors jostle for position ahead of the Federal Reserve’s (Fed) hotly-anticipated rate cut during the midweek market session. Despite a strong start to the day, the Dow Jones turned away from record peaks and dipped back into the previous day’s trading range.
US Retail Sales figures in August helped to keep market Fed expectations anchored, rising 0.1% compared to the median forecast of a -0.2% contraction. July’s Retail Sales figure was also revised higher to 1.1%, though core Retail Sales (excluding automotive purchases) only rose 0.1% compared to the 0.2% forecast.
The only meaningful event remaining on the data docket for stocks this week is the Fed’s upcoming rate call on Wednesday. Markets have been angling for a reduction in the Fed funds rate since the beginning of the year when investors were clamoring for a March cut. According to the CME’s FedWatch Tool, rate markets are still split on the depth of the Fed’s first expected rate trim since early 2020, with rate traders pricing in 60% odds of a 50 bps double cut to kick off the Fed’s next rate cutting cycle. The remaining 40% of rate cut expectations are stacked on a more reasonable 25 bps.
Dow Jones news
Despite an early pop into a fresh all-time intraday high on Tuesday, the Dow Jones remains broadly on-balance for the day. The DJIA is mixed, with half of the major index’s listed securities testing into the red.
Walmart Inc. (WMT) pared back recents gains, falling 2% on the day after hitting a fresh record high of $80.96 on Monday. The retail giant’s share price is now paring back, declining below $79 per share.
On the high end, Intel Corp (INTC) rallied another 3.3% to clear $21 per share after announcing plans to spin off the chipmaker’s foundry business into a subsidiary division, which would allow the computer hardware giant to raise additional outside funds. The news comes on the heels of an announcement this week that Intel would receive an additional $3 billion in federal grant funding despite plans to axe over 10% of the entire company’s workforce. Despite a near-term recovery, Intel’s valuation remains down around 60% for the year.
Dow Jones price forecast
Tuesday is proving to be a truly mixed day for the Dow Jones; despite setting a fresh record high bid above 41,750, the index is also testing into the low end and set to snap a four-day win streak. Investors are holding steady as the calendar runs down to the Fed’s upcoming rate call, but nerves are still on the frayed end, but a fast tumble to the 50-day Exponential Moving Average (EMA) at 40,493 can’t be ruled out.
A lack of meaningful technical resistance above price action makes it difficult for bulls to price out a logical target, but intraday bidders will be cautious with early pullback signs forming on the daily candlesticks.
Dow Jones daily chart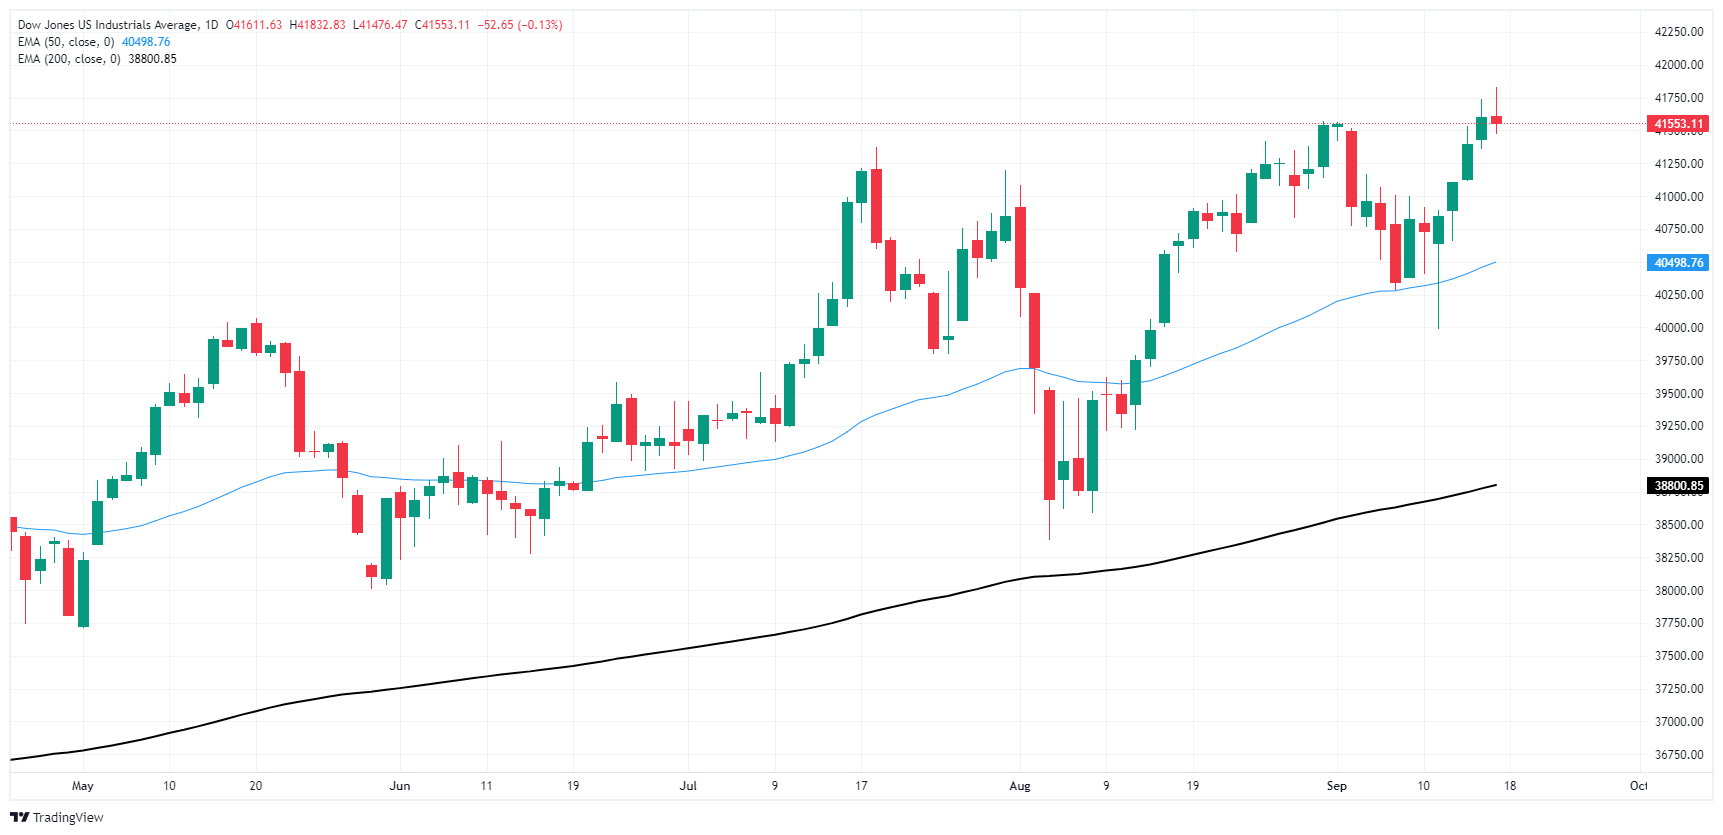
Dow Jones FAQs
The Dow Jones Industrial Average, one of the oldest stock market indices in the world, is compiled of the 30 most traded stocks in the US. The index is price-weighted rather than weighted by capitalization. It is calculated by summing the prices of the constituent stocks and dividing them by a factor, currently 0.152. The index was founded by Charles Dow, who also founded the Wall Street Journal. In later years it has been criticized for not being broadly representative enough because it only tracks 30 conglomerates, unlike broader indices such as the S&P 500.
Many different factors drive the Dow Jones Industrial Average (DJIA). The aggregate performance of the component companies revealed in quarterly company earnings reports is the main one. US and global macroeconomic data also contributes as it impacts on investor sentiment. The level of interest rates, set by the Federal Reserve (Fed), also influences the DJIA as it affects the cost of credit, on which many corporations are heavily reliant. Therefore, inflation can be a major driver as well as other metrics which impact the Fed decisions.
Dow Theory is a method for identifying the primary trend of the stock market developed by Charles Dow. A key step is to compare the direction of the Dow Jones Industrial Average (DJIA) and the Dow Jones Transportation Average (DJTA) and only follow trends where both are moving in the same direction. Volume is a confirmatory criteria. The theory uses elements of peak and trough analysis. Dow’s theory posits three trend phases: accumulation, when smart money starts buying or selling; public participation, when the wider public joins in; and distribution, when the smart money exits.
There are a number of ways to trade the DJIA. One is to use ETFs which allow investors to trade the DJIA as a single security, rather than having to buy shares in all 30 constituent companies. A leading example is the SPDR Dow Jones Industrial Average ETF (DIA). DJIA futures contracts enable traders to speculate on the future value of the index and Options provide the right, but not the obligation, to buy or sell the index at a predetermined price in the future. Mutual funds enable investors to buy a share of a diversified portfolio of DJIA stocks thus providing exposure to the overall index.
Recommended Articles


