


US Dollar rises to near eight-day high ahead of PPI
- The US Dollar popped higher on Wednesday after a surprise uptick in Core CPI data.
- Markets gear up for another batch of data, with weekly Jobless Claims and PPI.
- The US Dollar Index is on the brink of popping above 102.00, which would break out of its bandwidth from recent weeks.
The US Dollar (USD) trades broadly flat on Thursday, clinging to gains posted on Wednesday after US core inflation surprised to the upside. After the US inflation data,, markets have now nearly fully priced in a 25 basis point (bp) rate cut by the Federal Reserve meeting on September 18, largely ruling out the possibility of a larger cut. Meanwhile, markets will shift focus to the other side of the Atlantic Ocean, where the European Central Bank (ECB) is set to announce a 25-basis-point rate cut.
Amidst the ECB rate decision, a rather full data set out of the US will be released. Besides the weekly Jobless Claims, the Producer Price Index (PPI) will shed more light on the inflation front. Expect thus some volatility across the board for both the Euro and the US Dollar, with the DXY US Dollar Index bound to move substantially.
Daily digest market movers: ECB message will be vital
- The European Central Bank (ECB) will draw most attention this Thursday, with a near certainty of a 25 basis point rate cut. More important will be the message ECB President Christine Lagarde will bring after some concerning headlines regarding the performance of the German economy and other countries in the Eurozone. The rate decision will be published at 12:15 GMT, and the press conference will start at 12:45 GMT.
- In the US, Weekly Jobless Claims will be released near 12:30 GMT, with Initial Claims expected to mildly jump to 230,000 from 227,00. Continuing Claims were previously at 1.838 million.
- Together with the weekly Jobless Claims, the Producer Price Index (PPI) for August will be released:
- The monthly headline PPI is expected to grow at a stable 0.1%, and the yearly headline PPI should ease to 1.8% from 2.2% a month earlier.
- The monthly core PPI is expected to increase by 0.2% after being unchanged a month earlier, while the yearly core PPI is expected to rise by 2.5%, accelerating from the 2.4% increase seen in July.
- The US Treasury will swamp the bond market with a 4-week bill auction at 15:30 GMT, and a 30-year bond auction at 17:00 GMT.
- Equities have priced in the 25 basis point rate cut for the Fed next week, and are jumping higher this Thursday. The ECB set to deliver a rate cut as well, and European equities are rallying over 1% on the day.
- The CME Fedwatch Tool shows a 87.0% chance of a 25 basis points (bps) interest rate cut by the Fed on September 18 against a 13.0% chance for a 50 bps cut. For the meeting on November 7, another 25 bps cut (if September is a 25 bps cut) is expected by 49.3%, while there is a 45.0% chance that rates will be 75 bps (25 bps + 50 bps) and a 5.6% probability of rates being 100 (25 bps + 75 bps) basis points lower.
- The US 10-year benchmark rate trades at 3.67%, off the fresh 15-month low at 3.60%.
US Dollar Index Technical Analysis: Here comes the breakout
The US Dollar Index (DXY) is churning higher this week, testing the higher level of the range it has been trading since the end of August. The level to challenge is 101.90, and it could get broken with some help from the ECB. Seeing the recent weak economic data coming from the Eurozone, the ECB might need to go for more rate cuts to spur the economy. This would widen the rate differential between the US and the Eurozone, resulting. in a stronger US Dollar and a stronger DXY.
The first resistance at 101.90 is getting ready for a third test after its rejection last week and earlier this week. Further up, a steep 1.2% uprising would be needed to get the index to 103.18. The next tranche up is a very misty one, with the 55-day Simple Moving Average (SMA) at 103.40, followed by the 200-day SMA at 103.89, just ahead of the big 104.00 round level.
On the downside, 100.62 (the low from December 28) holds strong and has already made the DXY rebound four times in recent weeks. Should it break, the low from July 14, 2023, at 99.58, will be the ultimate level to look out for. Once that level gives way, early levels from 2023 are coming in near 97.73.
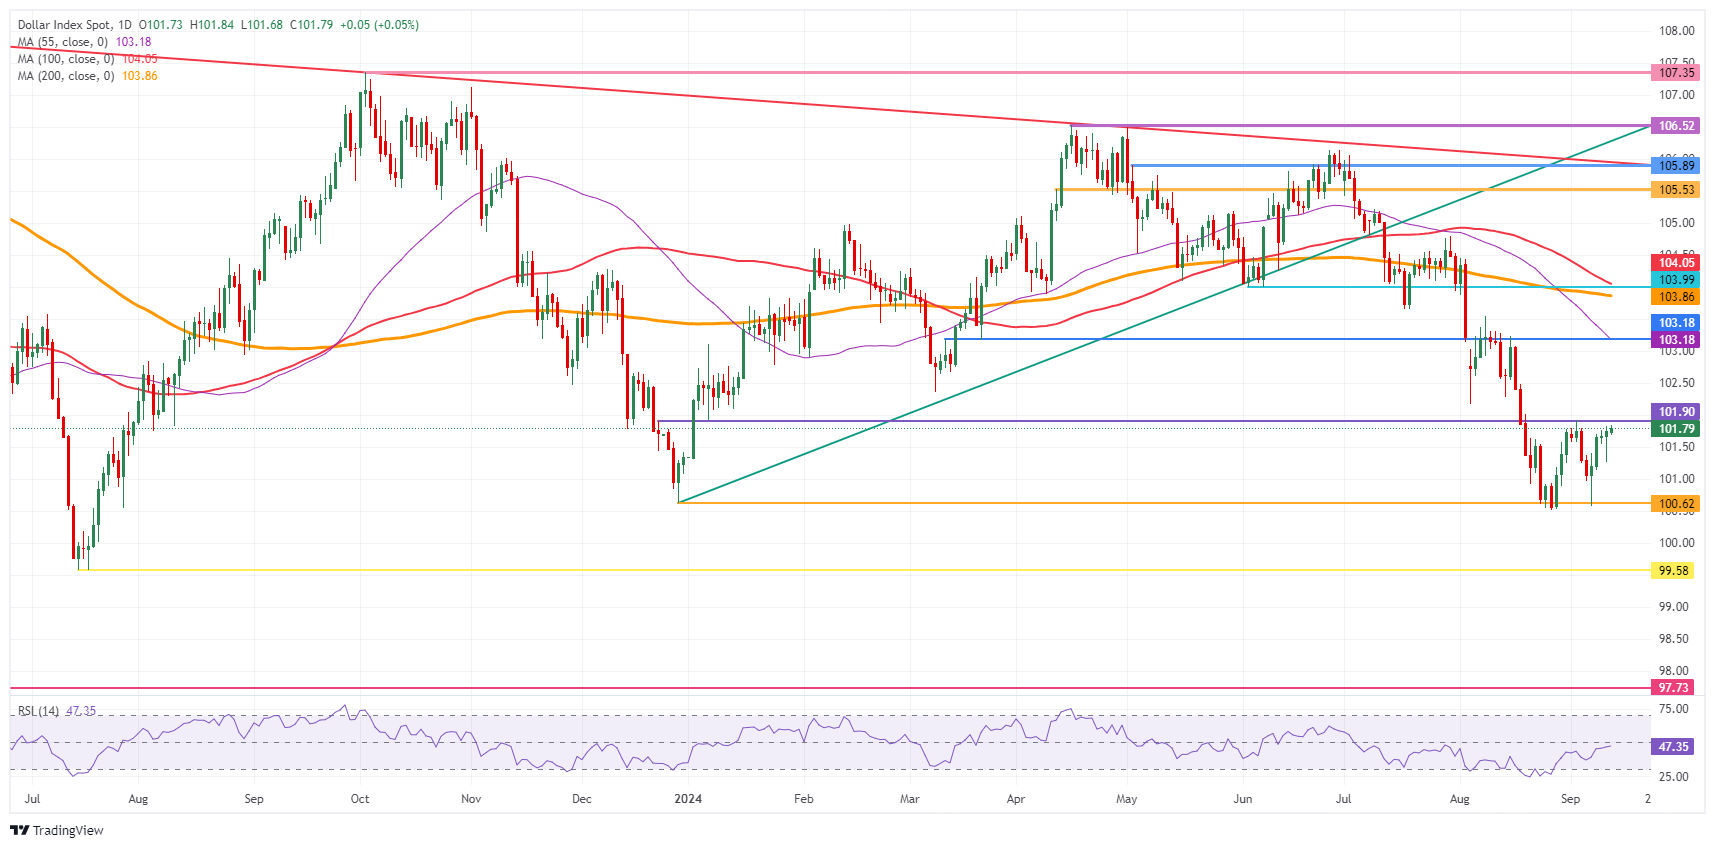
US Dollar Index: Daily Chart
US Dollar FAQs
The US Dollar (USD) is the official currency of the United States of America, and the ‘de facto’ currency of a significant number of other countries where it is found in circulation alongside local notes. It is the most heavily traded currency in the world, accounting for over 88% of all global foreign exchange turnover, or an average of $6.6 trillion in transactions per day, according to data from 2022. Following the second world war, the USD took over from the British Pound as the world’s reserve currency. For most of its history, the US Dollar was backed by Gold, until the Bretton Woods Agreement in 1971 when the Gold Standard went away.
The most important single factor impacting on the value of the US Dollar is monetary policy, which is shaped by the Federal Reserve (Fed). The Fed has two mandates: to achieve price stability (control inflation) and foster full employment. Its primary tool to achieve these two goals is by adjusting interest rates. When prices are rising too quickly and inflation is above the Fed’s 2% target, the Fed will raise rates, which helps the USD value. When inflation falls below 2% or the Unemployment Rate is too high, the Fed may lower interest rates, which weighs on the Greenback.
In extreme situations, the Federal Reserve can also print more Dollars and enact quantitative easing (QE). QE is the process by which the Fed substantially increases the flow of credit in a stuck financial system. It is a non-standard policy measure used when credit has dried up because banks will not lend to each other (out of the fear of counterparty default). It is a last resort when simply lowering interest rates is unlikely to achieve the necessary result. It was the Fed’s weapon of choice to combat the credit crunch that occurred during the Great Financial Crisis in 2008. It involves the Fed printing more Dollars and using them to buy US government bonds predominantly from financial institutions. QE usually leads to a weaker US Dollar.
Quantitative tightening (QT) is the reverse process whereby the Federal Reserve stops buying bonds from financial institutions and does not reinvest the principal from the bonds it holds maturing in new purchases. It is usually positive for the US Dollar.
Recommended Articles


