

US equities climb after US GDP beat, S&P closes at record high once again
- US stocks rally after US GDP prints above expectations.
- US PCE Price Index inflation due on Friday.
- Fed slated for another rate call next Wednesday.
US equity indexes climbed into fresh record highs on Thursday after US economic data beat the street with US Gross Domestic Product (GDP) growing faster than median market forecasts anticipated.
US annualized GDP grew by 3.3% in the fourth quarter, well above the forecast 2.0% but still below the previous quarter’s 4.9%, driving markets into a buying frenzy and pinning stocks into record highs.
US data will cap off the trading week with US Personal Consumption Expenditure (PCE) Price Index numbers on Friday. December’s MoM PCE is forecast to tick up slightly to 0.2% from the previous month’s 0.1% in a year-end inflation rebound, but the annualized PCE is expected to tick lower to 3.0% from 3.2% as overall inflationary pressure through the year continues to ease.
Swaps markets are still pricing in a first Federal Reserve (Fed) rate trim in May, with money markets betting on 140 basis points in overall rate cuts through 2024.
The Dow Jones Industrial Average (DJIA) climbed 0.64% to close up 242.74 points at $38,049.13, while the NASDAQ Composite index rose 28.58 points to close in the green 0.18% at $15,510.50.
The Standard & Poor’s (S&P) 500 major equity index closed at an all-time high for the fifth consecutive trading day, gaining 25.61 points and closing at $4,894.16 as the index continues to inch towards the major $5,000.00 handle.
S&P Technical Outlook
The S&P gained on Thursday to hit its highest closing bid ever, setting a fifth consecutive daily close in record territory. Intraday price action saw support from the 50-hour Simple Moving Average (SMA) near $4,870.00, with a near-term technical floor at the 200-hour SMA rising into $4,800.00.
The S&P 500 is up nearly 20% from the last major swing low into $4,102.00 in late October, and the index has ridden a bullish technical rejection from the 200-day SMA into record highs with an immediate technical barrier at the 50-day SMA approaching the $4,700.00 handle.
S&P Hourly Chart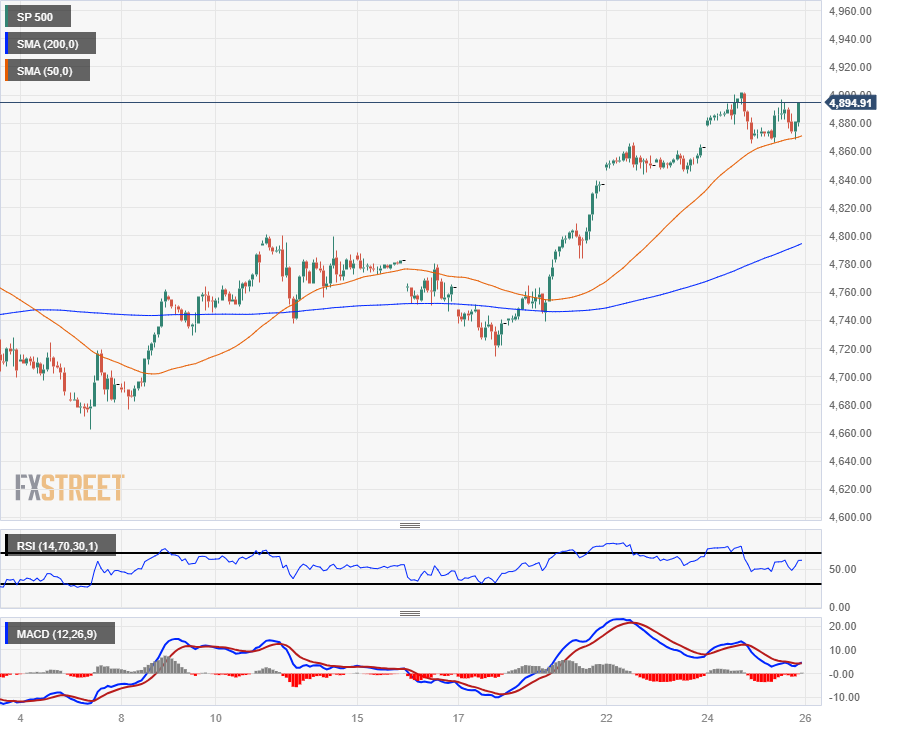
S&P Daily Chart
Recommended Articles


