


US Dollar retreats across the board with markets nervous about US data
- The US Dollar snaps recovery and retreats against most major peers.
- The Greenback sees earlier gains evaporate in recession fears emerging again.
- The US Dollar index trades back below 103.00 in technical rejection.
The US Dollar (USD) eases across the board against nearly all major peers in what turns out to be a nervous Thursday. Markets are trembling in the run-up to the weekly US Jobless Claims data, which will be released later in the day. It was this same data point that sparked the volatile patch last week ahead of the US Jobs reports and resulted in the massive sell-off on Monday across all asset classes.
On the economic data front, there is a very light calendar ahead. Because of this very calm trading week in terms of economic data, the weekly Initial Jobless Claims print for the week ending on August 2 will gain importance in magnitude. Thus, expect a rough ride later this Thursday on the back of the Jobless Claims data.
Daily digest market movers: Volatility to pick up again
- The economic calendar kicks off at 12:30 GMT with, straight away, the main event being presented: The weekly Jobless Claims
- Initial Claims for the week ending August 2 are expected to head to 240,000 from 249,000.
- Continuing Claims were at 1,877,000. No forecast for the week ending July 26 is pencilled in.
- At 14:00 GMT, Wholesale Inventories data for June is expected to grow by 0.2%, at the same pace as the previous month.
- At 17:00 GMT, the US Treasury will auction a 30-year bond.
- Equity markets are losing steam, with nearly all European incidences in the red. US futures are down as well, though slightly.
- The CME Fedwatch Tool shows a 72.5% chance of a 50 basis points (bps) interest rate cut by the Federal Reserve (Fed) in September. Another 25 bps cut is expected in November by 55.6%, while a 27.2% chance for a 50 bps cut and 17.2% for no cut are being pencilled in for that meeting.
- The US 10-year benchmark rate trades at 3.91%, retreating from this week’s high at 3.98%.
US Dollar Index Technical Analysis: Nervous rejection
The US Dollar Index (DXY) is starting to look dangerous, as Dollar bulls cannot get that daily close above 103.18. This Thursday's decline can be seen as a firm rejection which could result in another leg lower. If the Jobless Claims report this Thursday turns ugly again, a nosedive to 101.00 could not be unthinkable.
Still the first point to recover and gain importance every day is that 103.18, a level held on Friday though snapped on Monday in the Asian hours, is being tested. Once the DXY closes above that level, next up is 104.00, which was the support from June. If the DXY can make its way back above that level, the 200-day Simple Moving Average (SMA) at 104.17 is the next resistance level to look out for.
On the downside, the oversold condition in the Relative Strength Index (RSI) indicator has eased in the daily chart and holds room again for a small leg lower. Support nearby is the March 8 low at 102.35. Once through there, pressure will start to build on 102.00 as a big psychological figure before testing 101.90, which was a pivotal level in December 2023 and January 2024.
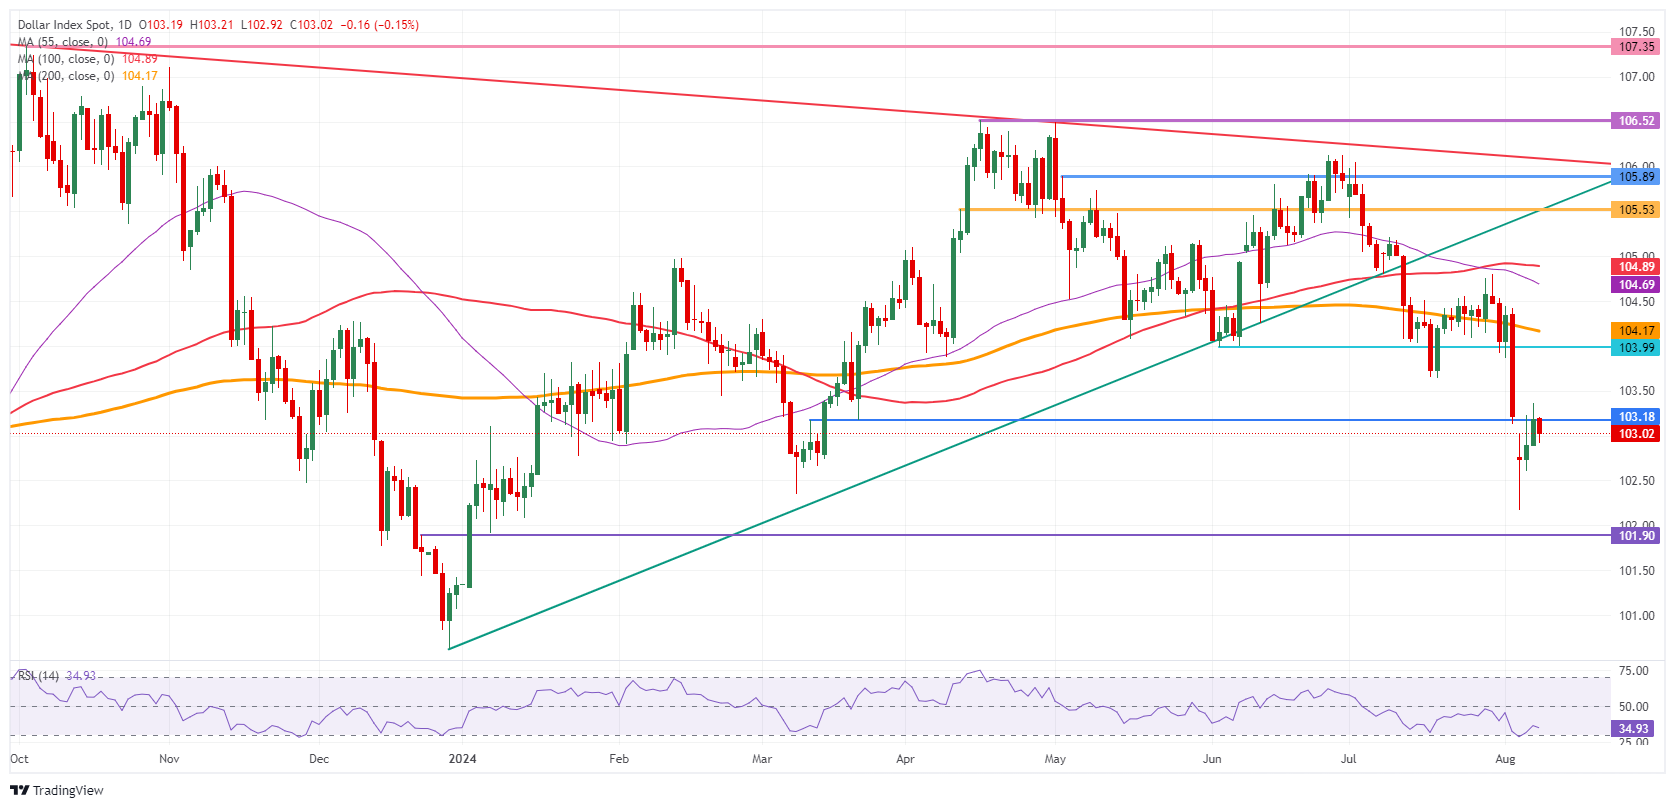
US Dollar Index: Daily Chart
Employment FAQs
Labor market conditions are a key element in assessing the health of an economy and thus a key driver for currency valuation. High employment, or low unemployment, has positive implications for consumer spending and economic growth, boosting the value of the local currency. Moreover, a very tight labor market – a situation in which there is a shortage of workers to fill open positions – can also have implications on inflation levels because low labor supply and high demand leads to higher wages.
The pace at which salaries are growing in an economy is key for policymakers. High wage growth means that households have more money to spend, usually leading to price increases in consumer goods. In contrast to more volatile sources of inflation such as energy prices, wage growth is seen as a key component of underlying and persisting inflation as salary increases are unlikely to be undone. Central banks around the world pay close attention to wage growth data when deciding on monetary policy.
The weight that each central bank assigns to labor market conditions depends on its objectives. Some central banks explicitly have mandates related to the labor market beyond controlling inflation levels. The US Federal Reserve (Fed), for example, has the dual mandate of promoting maximum employment and stable prices. Meanwhile, the European Central Bank’s (ECB) sole mandate is to keep inflation under control. Still, and despite whatever mandates they have, labor market conditions are an important factor for policymakers given their significance as a gauge of the health of the economy and their direct relationship to inflation.
Recommended Articles


