

US Dollar gaps in Asia open after Trump got shot over the weekend
- The US Dollar gaps at the Asian opening on Monday morning.
- Former US President Trump was injured in a shooting during a political rally.
- The US Dollar index jumps higher, it is on the way to fill the gap.
The US Dollar (USD) gaped up at the start of the week on pressure from Dollar bulls, who wanted to buy the Greenback as a safe haven after former US President Donald Trump was shot during an election rally. Trump was injured in the ear but is doing well, and he is set to give a speech later this Monday. The events made the bond market rally, with Trump’s popularity set to surge now, outpacing current US President Joe Biden.
On the economic front, expect this week that the different data points will be overshadowed by headlines from what happened over the weekend and with the rallies taking place, especially where Trump will attend. Besides that, it is a soft start for the week, where US Retail Sales data for June, scheduled on Tuesday, will play the leading role. US Federal Reserve (Fed) Chairman Jerome Powell will enter an interview with David Rubenstein on Bloomberg later on Monday.
Daily digest market movers: Market reacts to a shooting
- Markets are trying to price in the events that took place over the weekend. Bond markets are selling off with higher yields, a similar move we saw a few weeks ago when former US President Donald Trump took the lead in the polls. Bond markets are worried about Trump's spending plans, which could cause the US deficit to proportions never seen in US history. Investors are selling off their US debt in the idea that it might devalue or, in the worst case, might even never be paid back.
- At 12:30 GMT, the NY Empire State Manufacturing Index for July will be released. It is expected to remain unchanged from the previous reading of -6.
- At 20:35 GMT, Federal Reserve Bank of San Francisco President Mary Daly participates in the "Fortune Brainstorm Tech 2024" session "The Bull, the Bear, and the Banker" with Fortune's Emma Hinchliffe in Utah, United States.
- US Federal Reserve Chairman Jerome Powell will be interviewed by David Rubenstein at the Economic Club of Washington, DC.
- Equity markets are very binary on Monday. Both Asian and European equities are in negative territory, while US futures are in the green.
- The CME Fedwatch Tool is broadly backing a rate cut in September. The odds now stand at 89.9% for a 25-basis-point cut. A rate pause stands at a 5.7% chance, while a 50-basis-point rate cut has a very thin 4.4% possibility.
- The US 10-year benchmark rate trades at 4.21% after trading higher at the Asian opening. Bond markets dipping lower on the possibility of Trump winning the US Presidential elections.
US Dollar Index Technical Analysis: Trump triggers slight rebound
The US Dollar Index (DXY) is getting some support on the back of the events from this weekend. In the past, Trump’s presidency supported the Greenback. The big question, though, which is different this time against his previous term, is whether these spending packages are still supportive of a stronger and more expensive Dollar, seeing the possible deterioration of the US deficit and exponential rise in US debt.
The DXY is residing below all three major Simple Moving Averages (SMA) on Monday after its meltdown last week. The first barrier to regain control over is the 200-day SMA at 104.38. Next, the 100-day SMA resides near 104.81 while the declining 55-day SMA is trading at 105.07.
On the downside, the weak spot has been identified now at 103.99/104.00. Expect to see pressure mounting on that level with each test. Certainly, when the DXY bounces off that level each time, the bounces' highs would become smaller until the support gives way. A technical element to look out for could be that the 55-day SMA starts to break below the 100-day SMA and/or the 200-day SMA, risking a ‘death cross’ in technical terms, which is a catalyst for a substantially longer-term sell-off.
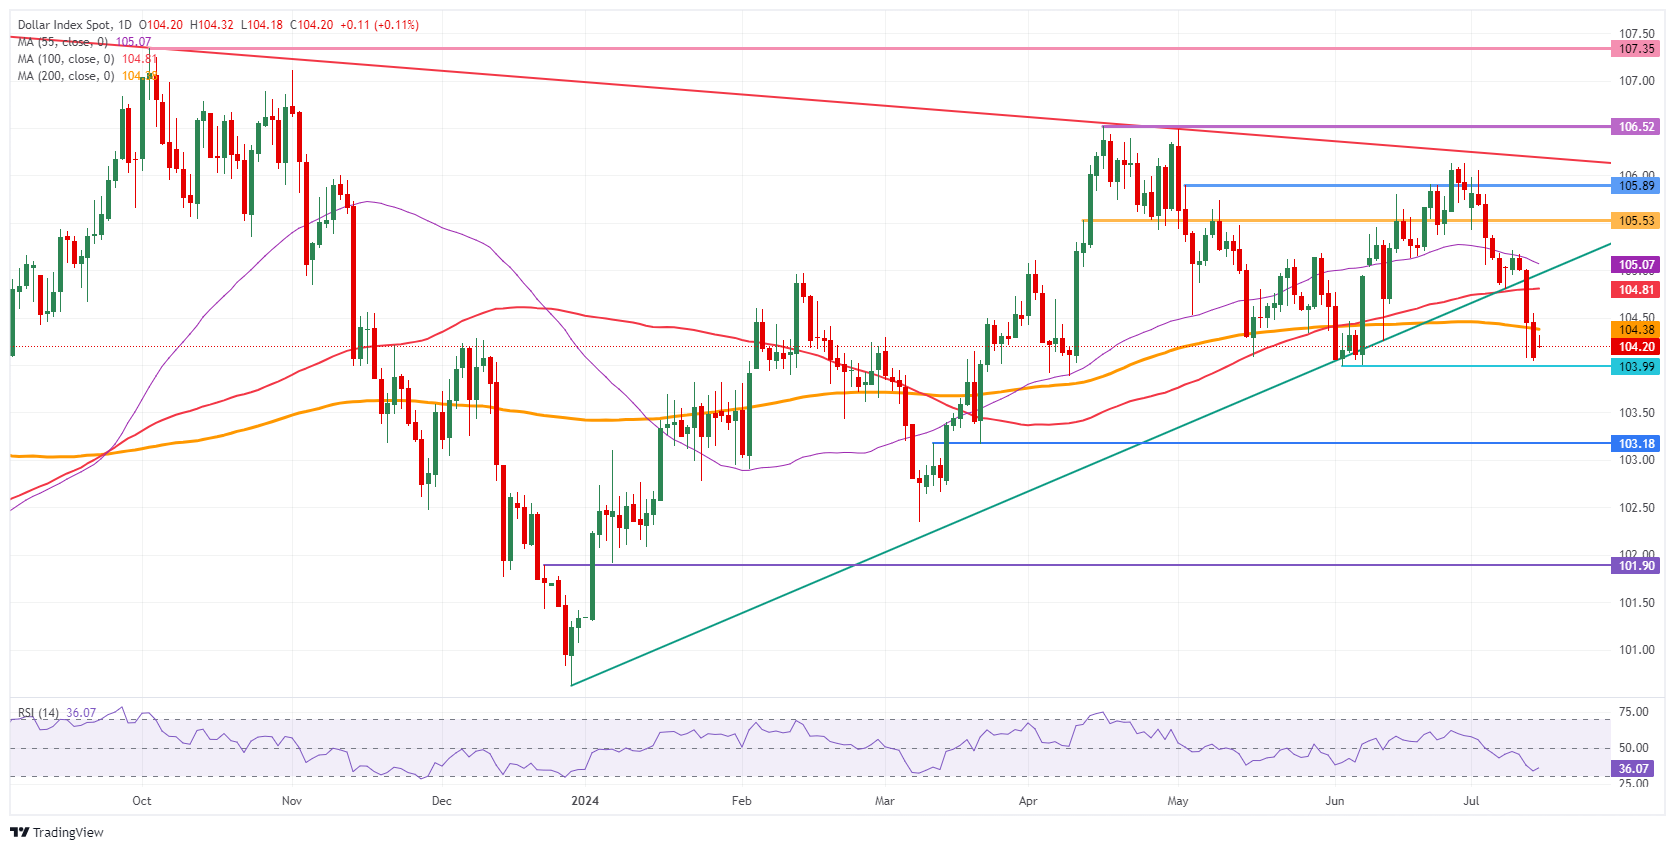
US Dollar Index: Daily Chart
US Dollar FAQs
The US Dollar (USD) is the official currency of the United States of America, and the ‘de facto’ currency of a significant number of other countries where it is found in circulation alongside local notes. It is the most heavily traded currency in the world, accounting for over 88% of all global foreign exchange turnover, or an average of $6.6 trillion in transactions per day, according to data from 2022. Following the second world war, the USD took over from the British Pound as the world’s reserve currency. For most of its history, the US Dollar was backed by Gold, until the Bretton Woods Agreement in 1971 when the Gold Standard went away.
The most important single factor impacting on the value of the US Dollar is monetary policy, which is shaped by the Federal Reserve (Fed). The Fed has two mandates: to achieve price stability (control inflation) and foster full employment. Its primary tool to achieve these two goals is by adjusting interest rates. When prices are rising too quickly and inflation is above the Fed’s 2% target, the Fed will raise rates, which helps the USD value. When inflation falls below 2% or the Unemployment Rate is too high, the Fed may lower interest rates, which weighs on the Greenback.
In extreme situations, the Federal Reserve can also print more Dollars and enact quantitative easing (QE). QE is the process by which the Fed substantially increases the flow of credit in a stuck financial system. It is a non-standard policy measure used when credit has dried up because banks will not lend to each other (out of the fear of counterparty default). It is a last resort when simply lowering interest rates is unlikely to achieve the necessary result. It was the Fed’s weapon of choice to combat the credit crunch that occurred during the Great Financial Crisis in 2008. It involves the Fed printing more Dollars and using them to buy US government bonds predominantly from financial institutions. QE usually leads to a weaker US Dollar.
Quantitative tightening (QT) is the reverse process whereby the Federal Reserve stops buying bonds from financial institutions and does not reinvest the principal from the bonds it holds maturing in new purchases. It is usually positive for the US Dollar.
Recommended Articles


