

US Dollar stabilizes ahead of US PPI release
- The US Dollar trades mixed on the quote board on Friday.
- Markes digest the recent disinflationary CPI print while Biden drops the ball at a crucial moment.
- The US Dollar index stabilizes after its sharp decline on Thursday.
The US Dollar (USD) trades very mixed on Friday, with markets looking for direction as a clear rotation is taking place in the equity markets. With an interest rate cut from the US Federal Reserve (Fed) being a near certainty in September, investors are shifting away from the big tech names and are heading into smaller stocks and blue chips that represent more niche sectors that should see demand pick up with more disposable income freed up once rates get cut. Meanwhile, concerns about US President Joe Biden increased after he called Russian President Vladimir Putin to Ukraine President Volodymyr Zelensky during a high-stakes NATO summit, which could mean the final straw for some of his financial donors.
On the economic front, a nice schedule ahead with the Producer Price Index (PPI) for June, where traders can assess if prices for producers and resellers are on the same disinflationary path as for the Consumer Price Index (CPI). Later this Friday, the University of Michigan will release its preliminary readings for July on Consumer Sentiment and inflation expectations. Expect some choppy action, with further easing numbers that might clash with Dollar bulls.
Daily digest market movers: Now it gets tricky
- US President Joe Biden dropped the ball in what several media outlets deemed as the make-or-break moment for the President. Unfortunately, President Biden dropped the ball yet again by calling Vice President Trump to his Vice President Camilla Harris and mixing up Ukraine President Volodymyr Zelensky with Russian President Vladimir Putin. It was painful to watch them shaking hands just after President Biden made the mistake.
- At 12:30 GMT, June’s Producer Price Index (PPI) numbers will come out:
- Monthly headline PPI is expected to tick up to 0.1% from -0.2%.
- Monthly core PPI should also tick up to 0.2% from 0.0%.
- Annual headline PPI is expected to increase marginally to 2.3% from 2.2%.
- Annual core CPI is expected to grow by 2.5% from 2.3%.
- At 14:00 GMT, the University of Michigan will release its preliminary reading for July:
- Consumer Sentiment is expected to tick up to 68.5 from 68.2.
- 5-year consumer inflation expectations are expected to remain at 3%.
- Equity markets are seeing some sector rotation from investors now that a rate cut in September looks to be inevitable. Big tech stocks are seeing profit taking, while small and blue chips are seeing inflows. European equities are up near 0.50% on the day, while US futures are mildly in the red.
- The CME Fedwatch Tool is broadly backing a rate cut in September. The odds now stand at 86.4% for a 25-basis-point cut. A rate pause stands at a 7.5% chance, while a 50-basis-point rate cut has a slim 6.2% possibility.
- The US 10-year benchmark rate trades at 4.22%, after dipping to a fresh low for 2024 on Thursday in the CPI aftermath.
US Dollar Index Technical Analysis: DXY fell as much like Biden dropped the ball
The US Dollar Index (DXY) fell through several floors on Thursday in the aftermath of the CPI. Although a recovery took place right at the end of the trading session, pressure could come in again should PPI numbers also be in disinflation. Expect another pullback towards 104.00 with possibly a break lower in case Dollar bulls give up their position and cut their losses.
On the upside, a long road to recovery awaits. First up is the 100-day Simple Moving Average (SMA) near 104.81, just ahead of two heavy resistance levels, with the green ascending trend line in the chart below now as resistance near 104.95 and the 55-day SMA at 105.10. In case the DXY can puddle its way through all of that, 105.53 is the next upside level to look out for.
On the downside, the weak spot has been identified now at 103.99/104.00. Expect to see pressure mounting on that level with each test. Certainly, when the DXY bounces off that level each time, the bounces' highs would become smaller until the support gives way. Further down, a chunky decline is expected before finding the next vital support near 103.18.
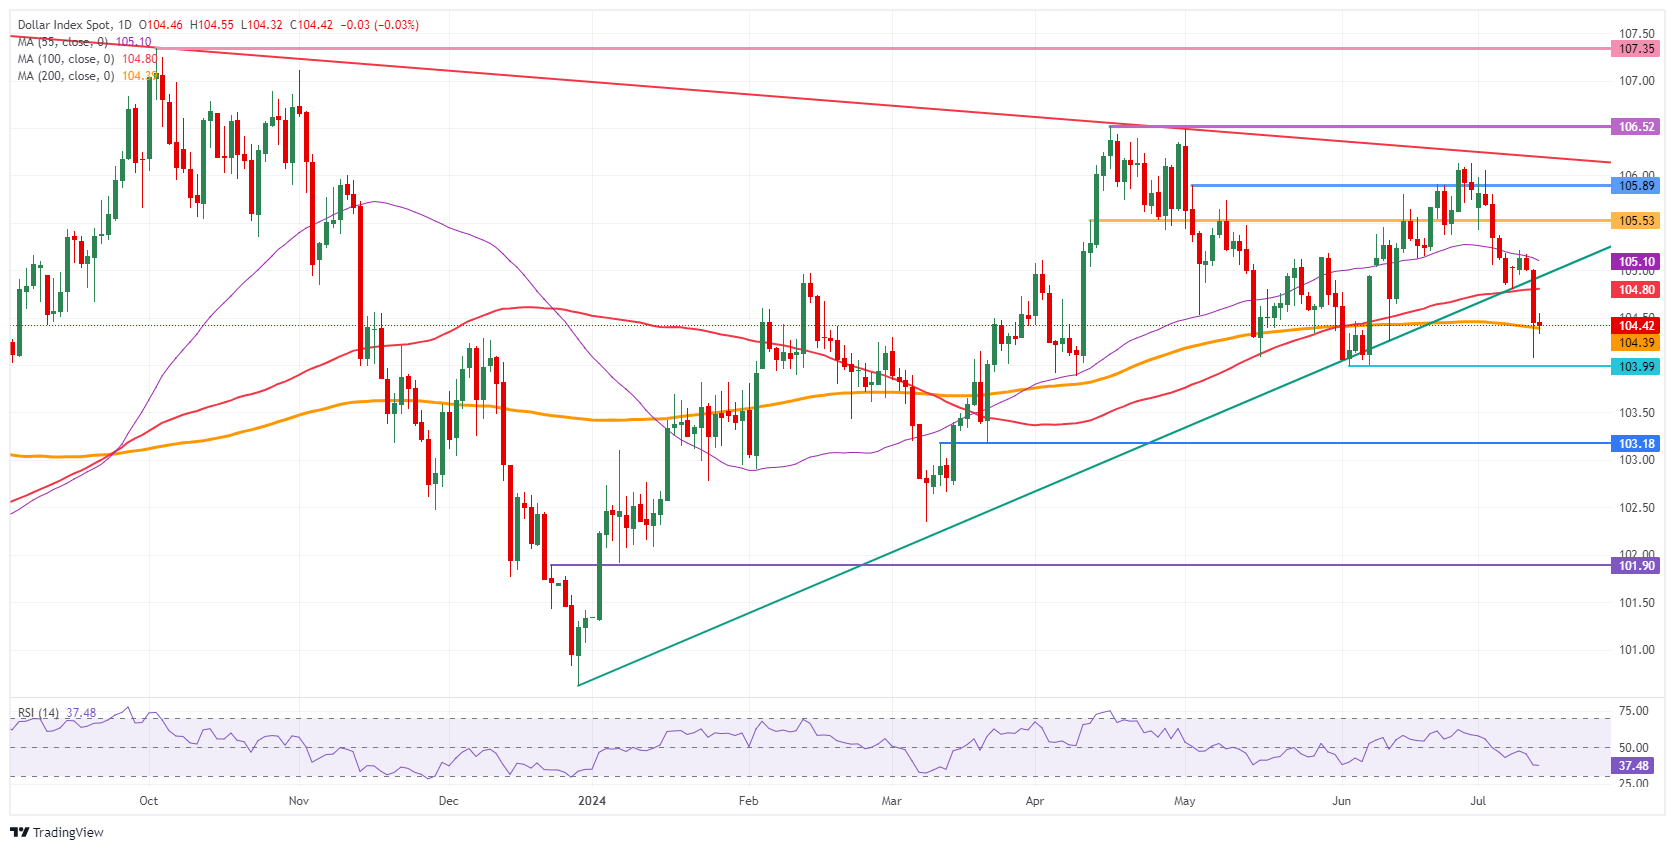
US Dollar Index: Daily Chart
US Dollar FAQs
The US Dollar (USD) is the official currency of the United States of America, and the ‘de facto’ currency of a significant number of other countries where it is found in circulation alongside local notes. It is the most heavily traded currency in the world, accounting for over 88% of all global foreign exchange turnover, or an average of $6.6 trillion in transactions per day, according to data from 2022. Following the second world war, the USD took over from the British Pound as the world’s reserve currency. For most of its history, the US Dollar was backed by Gold, until the Bretton Woods Agreement in 1971 when the Gold Standard went away.
The most important single factor impacting on the value of the US Dollar is monetary policy, which is shaped by the Federal Reserve (Fed). The Fed has two mandates: to achieve price stability (control inflation) and foster full employment. Its primary tool to achieve these two goals is by adjusting interest rates. When prices are rising too quickly and inflation is above the Fed’s 2% target, the Fed will raise rates, which helps the USD value. When inflation falls below 2% or the Unemployment Rate is too high, the Fed may lower interest rates, which weighs on the Greenback.
In extreme situations, the Federal Reserve can also print more Dollars and enact quantitative easing (QE). QE is the process by which the Fed substantially increases the flow of credit in a stuck financial system. It is a non-standard policy measure used when credit has dried up because banks will not lend to each other (out of the fear of counterparty default). It is a last resort when simply lowering interest rates is unlikely to achieve the necessary result. It was the Fed’s weapon of choice to combat the credit crunch that occurred during the Great Financial Crisis in 2008. It involves the Fed printing more Dollars and using them to buy US government bonds predominantly from financial institutions. QE usually leads to a weaker US Dollar.
Quantitative tightening (QT) is the reverse process whereby the Federal Reserve stops buying bonds from financial institutions and does not reinvest the principal from the bonds it holds maturing in new purchases. It is usually positive for the US Dollar.
Recommended Articles


