

Dow Jones Industrial Average whipsaws on quiet Monday
- Dow Jones found early highs before settling back into the low end.
- New trading week kicks things off with a breather after Friday’s NFP.
- US consumer and wholesale inflation figures are due this week.
The Dow Jones Industrial Average (DJIA) whipped on Monday, briefly testing fresh highs and breaking out of Friday’s tight churn before slumping into the red for the new trading week. Federal Reserve (Fed) Chairman Jerome Powell gives the first of a two-day Monetary Policy Report to the US Congress on Tuesday, with key US inflation figures slated for the back half of the trading week.
Fed Chair Powell will deliver the first half of his Monetary Policy Report to the Senate Banking Committee on Tuesday, followed by the same presentation to the House Committee on Financial Services on Wednesday. US Consumer Price Index (CPI) inflation is slated for Thursday, and US Producer Price Index (PPI) wholesale inflation is due Friday.
US inflation figures will be the key data print this week as investors look for signs of rate cuts from the Fed. Despite broad-market hopes for a rate trim, Fed officials have continued to lean into the wait for further evidence that inflation will ease back to the Fed’s 2% annual target. According to the CME’s FedWatch Tool, rate traders are pricing in nearly 80% odds of at least a quarter-point trim to the Fed funds rate on September 18, a little over ten weeks from now.
Waiting for this week’s inflation data will be tense. Core CPI for the year ended June is forecast to hold steady at 3.4% YoY, while core PPI inflation for the same period is expected to tick higher to 2.5% YoY from the previous 2.3% as inflationary pressures remain elevated at the producer-supplier level.
Dow Jones news
The Dow Jones index was mixed on Monday, with roughly half of the equity board’s constituent securities in the green for the day, but overall declines in key goods producers kept headline index prices subdued. Nike Inc. (NKE) fell -2.25% to $73.73 per share, extending into a fresh 52-week low and facing further declines as the shoe manufacturing giant sees growth problems for the year ahead as the footwear giant’s market share gets cannibalized by smaller, more strategic competitors.
Intel Corp. (INTC) surged on Monday, rising 5.3% to $33.72 per share after a note from Melius Research analysts suggested that NVIDIA Corp. (NVDA) competitors like Intel and Advanced Micro Devices Inc. (AMD) could play significant catchup in the AI space with current sector giant NVIDIA.
Dow Jones technical outlook
The Dow Jones Industrial Average (DJIA) rallied in early Monday trading, tapping into a fresh seven-week high of 39,663.30 before a sharp downturn erased the day’s gains. The Dow Jones slid to an intraday low just south of 39,275.00. The major equity index remains down around one-tenth of one percent on Monday.
The Dow Jones has churned in familiar chart territory just above the 50-day Exponential Moving Average (EMA) at 38,983.20 since recovering from late May’s bottom near 38,000.00. Despite holding firmly in the high end, bullish momentum remains limited, and Dow Jones bidders have so far failed to develop the necessary momentum to drag bids back over all-time highs set above the 40,000.00 major price handle.
Dow Jones five minute chart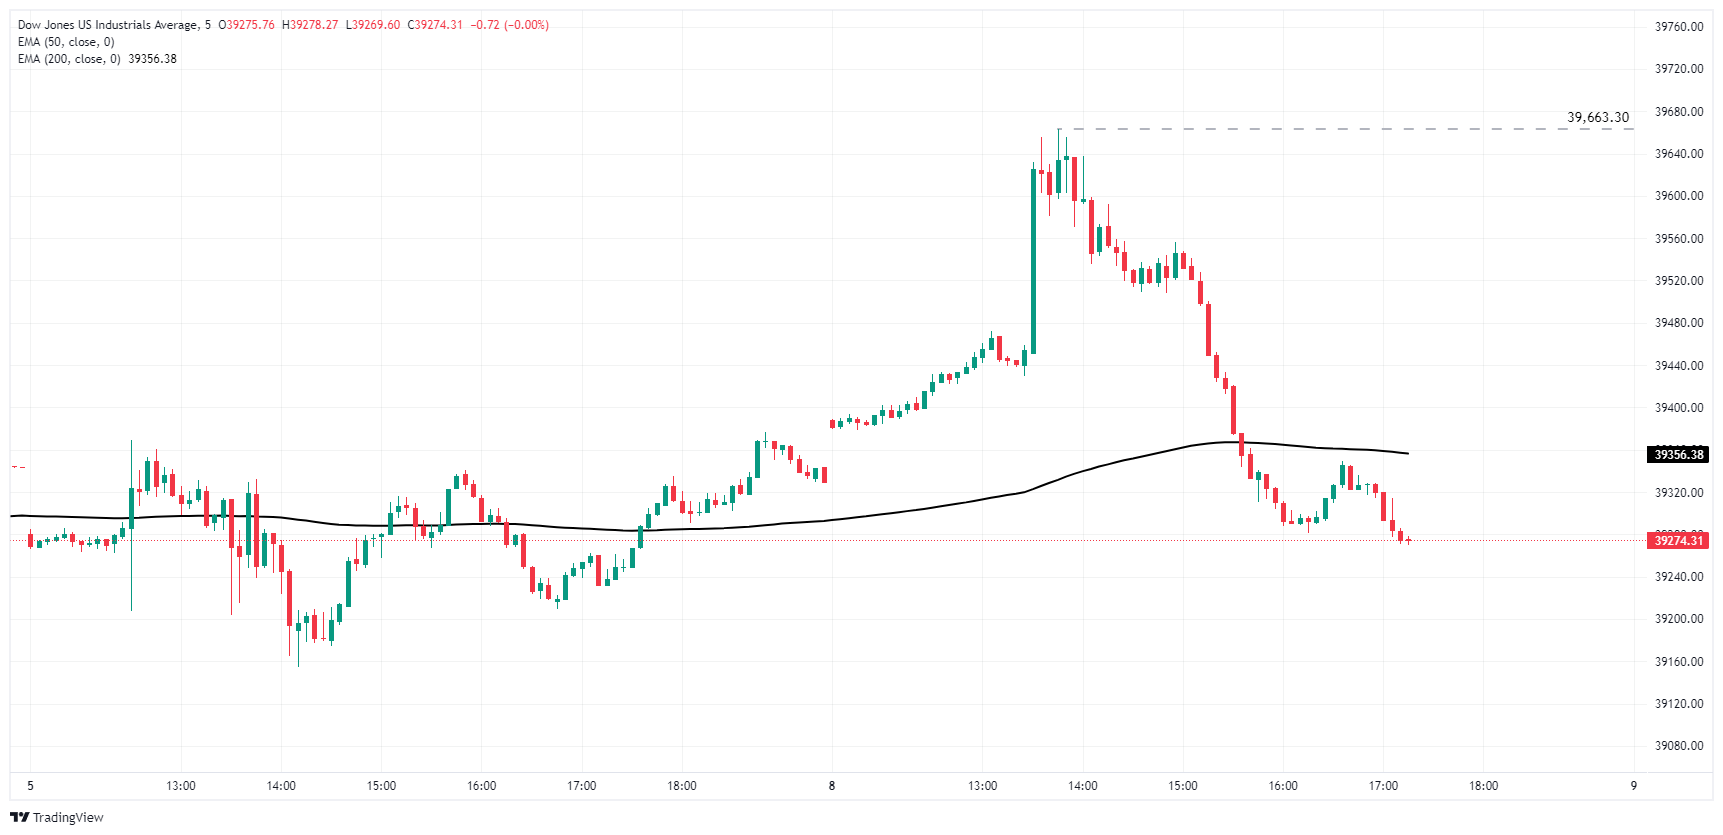
Dow Jones daily chart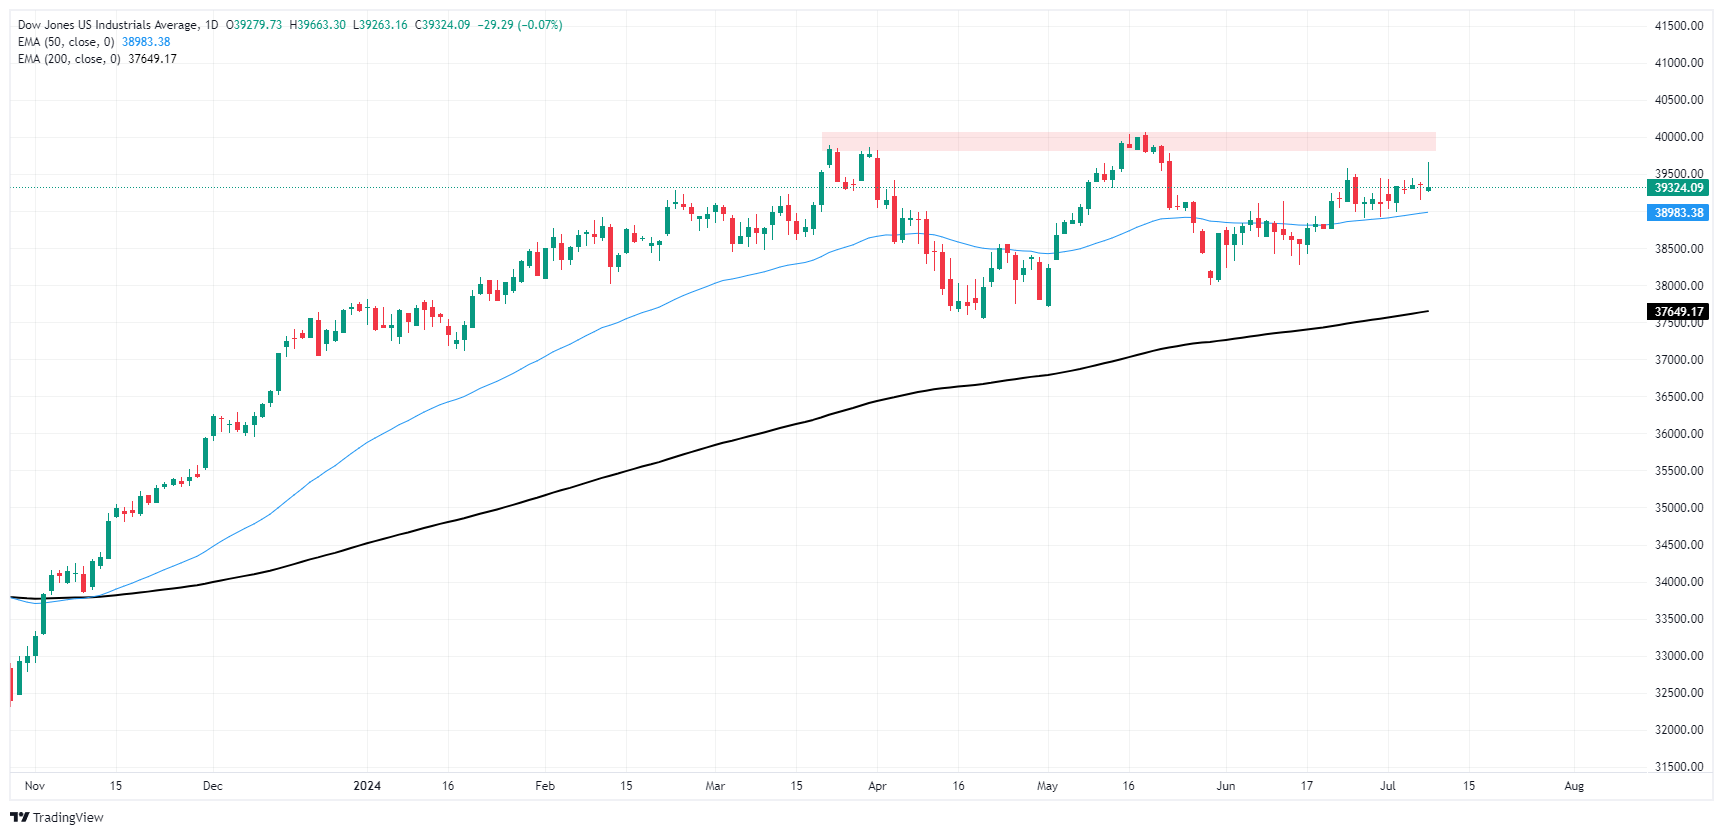
Dow Jones FAQs
The Dow Jones Industrial Average, one of the oldest stock market indices in the world, is compiled of the 30 most traded stocks in the US. The index is price-weighted rather than weighted by capitalization. It is calculated by summing the prices of the constituent stocks and dividing them by a factor, currently 0.152. The index was founded by Charles Dow, who also founded the Wall Street Journal. In later years it has been criticized for not being broadly representative enough because it only tracks 30 conglomerates, unlike broader indices such as the S&P 500.
Many different factors drive the Dow Jones Industrial Average (DJIA). The aggregate performance of the component companies revealed in quarterly company earnings reports is the main one. US and global macroeconomic data also contributes as it impacts on investor sentiment. The level of interest rates, set by the Federal Reserve (Fed), also influences the DJIA as it affects the cost of credit, on which many corporations are heavily reliant. Therefore, inflation can be a major driver as well as other metrics which impact the Fed decisions.
Dow Theory is a method for identifying the primary trend of the stock market developed by Charles Dow. A key step is to compare the direction of the Dow Jones Industrial Average (DJIA) and the Dow Jones Transportation Average (DJTA) and only follow trends where both are moving in the same direction. Volume is a confirmatory criteria. The theory uses elements of peak and trough analysis. Dow’s theory posits three trend phases: accumulation, when smart money starts buying or selling; public participation, when the wider public joins in; and distribution, when the smart money exits.
There are a number of ways to trade the DJIA. One is to use ETFs which allow investors to trade the DJIA as a single security, rather than having to buy shares in all 30 constituent companies. A leading example is the SPDR Dow Jones Industrial Average ETF (DIA). DJIA futures contracts enable traders to speculate on the future value of the index and Options provide the right, but not the obligation, to buy or sell the index at a predetermined price in the future. Mutual funds enable investors to buy a share of a diversified portfolio of DJIA stocks thus providing exposure to the overall index.
Recommended Articles


