


Dow Jones Industrial Average returns from midweek holiday on a comeback
- Dow Jones reclaims 39,000.00 handle as markets rebound post-Juneteenth holiday.
- Softening US data helps to bolster rate cut expectations.
- US PMIs still loom ahead on Friday.
The Dow Jones Industrial Average (DJIA) is surging upwards on Thursday as investors return to markets with a vengeance following the midweek Juneteenth holiday that shuttered US exchanges on Wednesday. US economic data cooled with May’s Building Permits and the Philadelphia Fed Manufacturing Survey for June both declining, while Initial Jobless Claims recovered less ground than expected to notch another print above the four-week average.
With US economic figures broadly missing the mark, investor hopes of the Federal Reserve (Fed) getting bullied into a rate cut sooner rather than later are pinned to the ceiling. According to the CME’s FedWatch Tool, rate markets are pricing in upwards of a 70% chance that the Fed will deliver at least a quarter-point cut on September 18.
Read more: US Initial Jobless Claims rose more than estimated last week
Despite recent economic data softening, the Fed continues to pursue a restrictive policy stance. Fed policymakers are determined to await several months of chilled inflation figures before considering policy rate shifts. Despite jiggles in week-on-week unemployment claims, the US jobs market remains incredibly tight, giving Fed officials a firm branch to lean on and avoid rushing into any abrupt policy adjustments.
US Purchasing Managers Index (PMI) figures will round out the trading week. Rate-cut-hungry investors are looking for a continued cooling effect in US economic data. The Manufacturing and Services PMIs are both forecast to etch in small losses, with June's Manufacturing PMI expected to tick down to 51.0 from 51.3 and the Services PMI component to shift down to 53.7 from 54.8.
Dow Jones news
The Dow Jones is firmly higher on Thursday, with all but five of the index’s constituent securities lower on the day. Apple Inc. (AAPL) is leading declines, shedding 2.0% and falling below $210.00 per share as investors rethink a recent splurge driven by Apple’s announcement of further integration of AI tech into pre-existing Apple software offerings. Apple also announced the closure of its Pay Later program, which allowed Apple customers to make purchases on an in-house financed installment plan.
On the high side, Salesforce Inc. (CRM) climbed 4.5% on Thursday after the digital customer data management firm announced its own fresh batch of AI-tech integrations to investors. CRM climbed over $242.00 per share as investors continue to scoop up AI tech announcements with little concern over how these companies will convert AI integrations into more sales.
Dow Jones tech outlook
The Dow Jones index climbed to fresh highs for the week on Thursday, testing its highest bids in almost four weeks to reclaim the 39,000.00 handle. The DJIA is testing chart territory north of 39,200.00 and has made significant one-day progress to grinding its way back to all-time highs set above 40,000.00 in May.
Daily candlesticks have lept back over the 50-day Exponential Moving Average (EMA) at 38,825.00, extending a recovery from a recent plunge to the 38,000.00 region.
Dow Jones five minute chart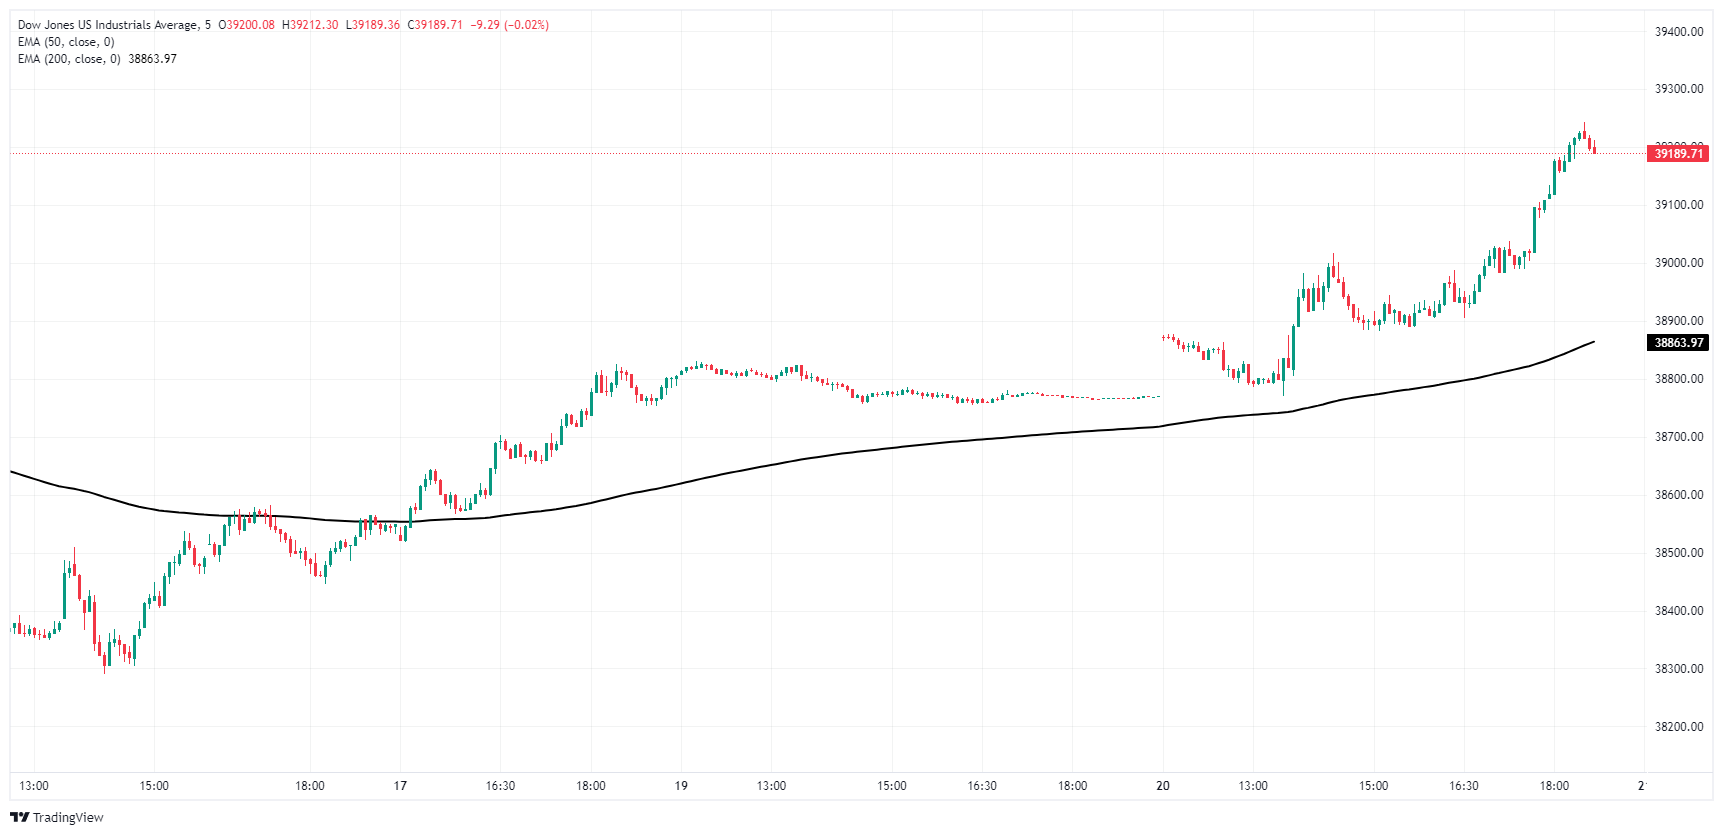
Dow Jones daily chart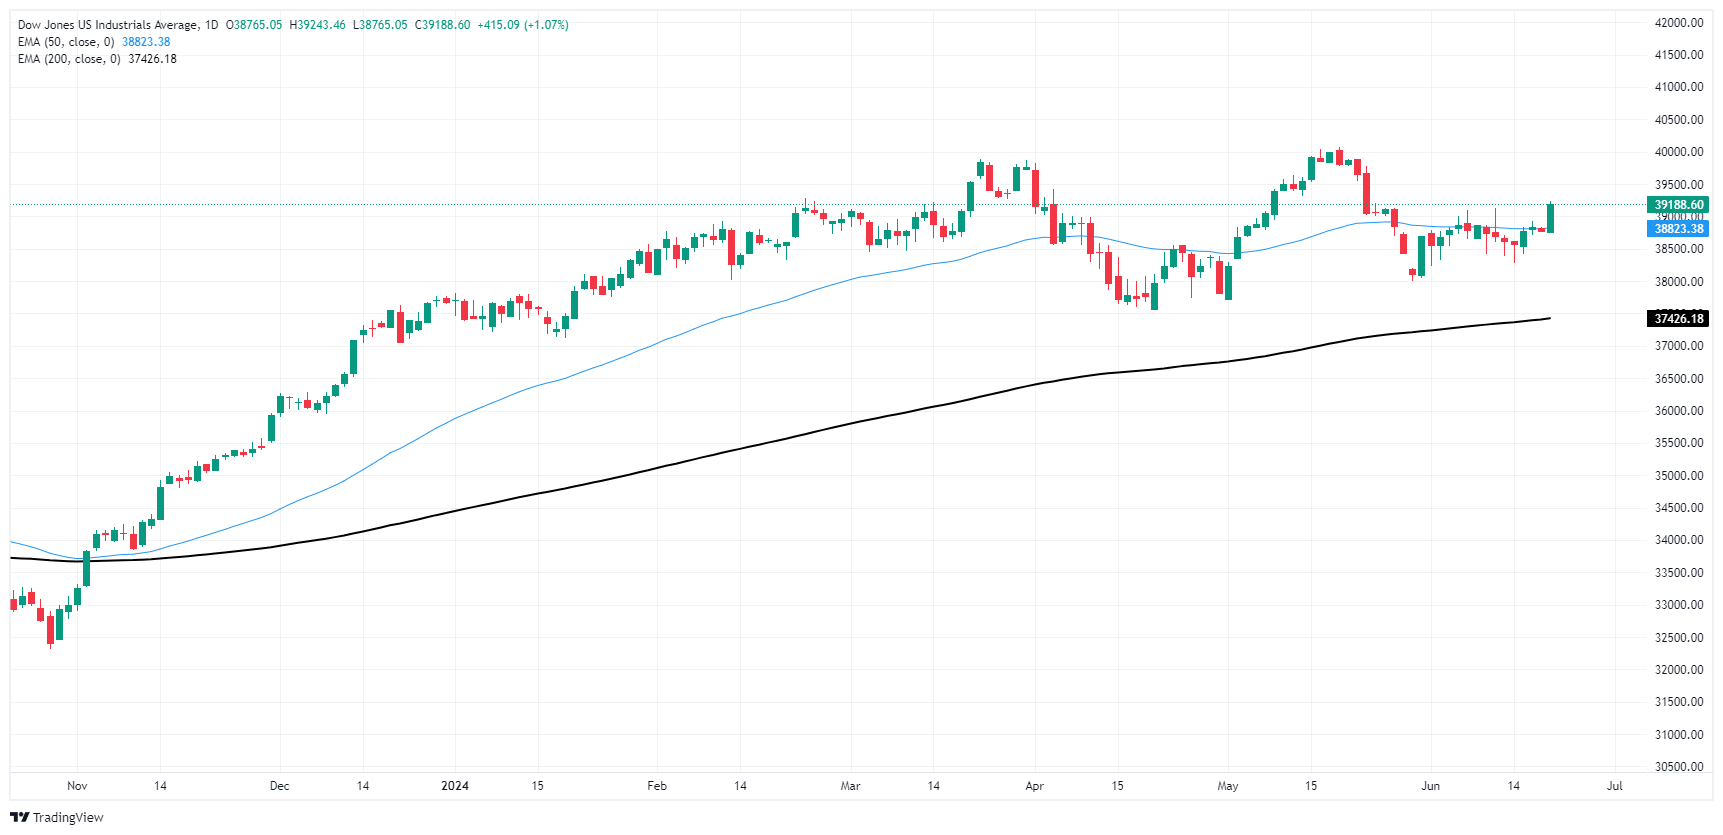
Dow Jones FAQs
The Dow Jones Industrial Average, one of the oldest stock market indices in the world, is compiled of the 30 most traded stocks in the US. The index is price-weighted rather than weighted by capitalization. It is calculated by summing the prices of the constituent stocks and dividing them by a factor, currently 0.152. The index was founded by Charles Dow, who also founded the Wall Street Journal. In later years it has been criticized for not being broadly representative enough because it only tracks 30 conglomerates, unlike broader indices such as the S&P 500.
Many different factors drive the Dow Jones Industrial Average (DJIA). The aggregate performance of the component companies revealed in quarterly company earnings reports is the main one. US and global macroeconomic data also contributes as it impacts on investor sentiment. The level of interest rates, set by the Federal Reserve (Fed), also influences the DJIA as it affects the cost of credit, on which many corporations are heavily reliant. Therefore, inflation can be a major driver as well as other metrics which impact the Fed decisions.
Dow Theory is a method for identifying the primary trend of the stock market developed by Charles Dow. A key step is to compare the direction of the Dow Jones Industrial Average (DJIA) and the Dow Jones Transportation Average (DJTA) and only follow trends where both are moving in the same direction. Volume is a confirmatory criteria. The theory uses elements of peak and trough analysis. Dow’s theory posits three trend phases: accumulation, when smart money starts buying or selling; public participation, when the wider public joins in; and distribution, when the smart money exits.
There are a number of ways to trade the DJIA. One is to use ETFs which allow investors to trade the DJIA as a single security, rather than having to buy shares in all 30 constituent companies. A leading example is the SPDR Dow Jones Industrial Average ETF (DIA). DJIA futures contracts enable traders to speculate on the future value of the index and Options provide the right, but not the obligation, to buy or sell the index at a predetermined price in the future. Mutual funds enable investors to buy a share of a diversified portfolio of DJIA stocks thus providing exposure to the overall index.
Recommended Articles


