

Dow Jones Industrial Average opens with gains after strong US employment data
- Dow Jones trims losses following upbeat US employment data.
- A moderate slowdown in the yearly wage growth has eased investors’ concerns about the strong employment reading.
- The sharp reversal in the weekly chart suggests that a deeper correction might be in progress.
The Dow Jones Industrial Average (DJIA) traded higher in Friday’s morning session, following upbeat US employment figures. The index, however, is on track for its worst week in the last year as the strong US economic data has put the Federal Reserve’s (Fed) easing plans into question.
Net employment increased in March by 303K, following a 270,000 increment in February and beating expectations of about a 200K rise. Wage figures revealed that salaries keep rising although the moderation in the annual rate seems to have eased investors’ concerns.
On Thursday, Minneapolis Fed President Neel Kashkari suggested that with inflation steady at high levels the bank might refrain from cutting rates this year, which sent equity markets tumbling.
The main Wall Street indices are all positive on Friday. The NASDAQ is leading with a 1.38% advance to 16,271, followed by the S&P 500, up 1.17% at 5,207, and the Dow Jones, which adds 0.9% to 38,943.
Dow Jones news
All sectors are posting gains with Communication Services leading thanks to a 1.94% advance, followed by the Technology sector with a 1.64% gain. Industrials has gained 1.41%. The Utilities sector is the worst performer with a 0.31% advance.
Amazon (AMZN) is leading gains on Friday with a 3.17% rally to $185.66, followed by Salesforce (CRM), which advances 2.57% to $301.68. On the losing end, Intel (INTC) drops 2.16% to $38.87, still weighed down by the hefty losses reported for 2023. Next is McDonald’s (MCD) with a 0.86% decline to $267.777.
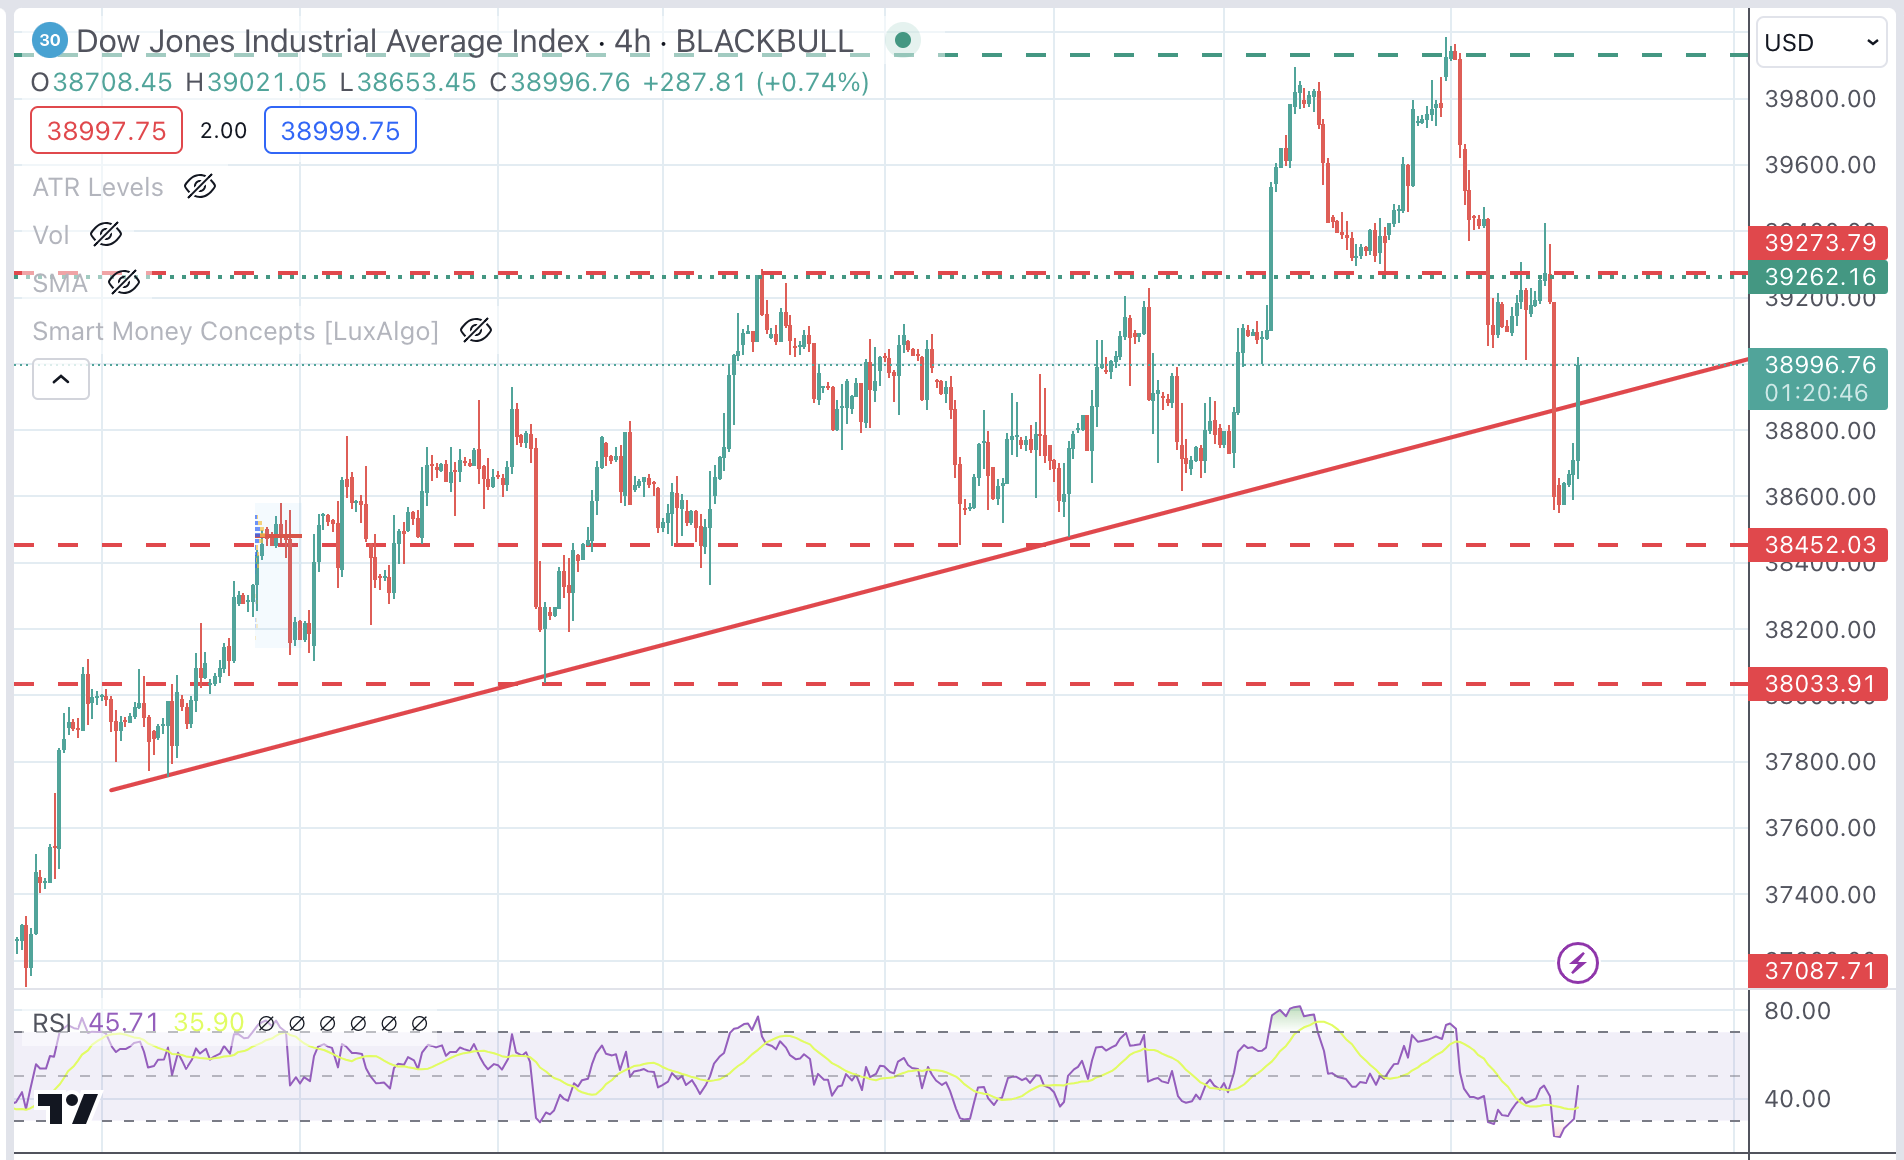
Dow Jones technical outlook
The index is trimming some losses on Friday, but the sharp reversal printed in the previous four trading days is forming a bearish engulfing candle on the weekly chart.
This formation often anticipates a major reversal. Price action has found demand above 38,500 to bounce up, but buyers might be challenged at the 39,265 resistance, which closes the path to the 40,000 top.
On the downside, a break of the 34,452 level would confirm a trend reversal and increase bearish pressure toward 38,035.
Dow Jones 4-Hour Chart
Employment FAQs
Labor market conditions are a key element to assess the health of an economy and thus a key driver for currency valuation. High employment, or low unemployment, has positive implications for consumer spending and thus economic growth, boosting the value of the local currency. Moreover, a very tight labor market – a situation in which there is a shortage of workers to fill open positions – can also have implications on inflation levels and thus monetary policy as low labor supply and high demand leads to higher wages.
The pace at which salaries are growing in an economy is key for policymakers. High wage growth means that households have more money to spend, usually leading to price increases in consumer goods. In contrast to more volatile sources of inflation such as energy prices, wage growth is seen as a key component of underlying and persisting inflation as salary increases are unlikely to be undone. Central banks around the world pay close attention to wage growth data when deciding on monetary policy.
The weight that each central bank assigns to labor market conditions depends on its objectives. Some central banks explicitly have mandates related to the labor market beyond controlling inflation levels. The US Federal Reserve (Fed), for example, has the dual mandate of promoting maximum employment and stable prices. Meanwhile, the European Central Bank’s (ECB) sole mandate is to keep inflation under control. Still, and despite whatever mandates they have, labor market conditions are an important factor for policymakers given its significance as a gauge of the health of the economy and their direct relationship to inflation.
Recommended Articles


