

Dow Jones Industrial Average opens with minor gains, still well below last week’s highs
- Dow Jones ticks up Tuesday in a calm pre-Easter trading session.
- Market sentiment is moderately positive, buoyed by hopes that the Fed will start cutting rates in June.
- Trading volume remains at low levels with investors awaiting Friday’s PCE Prices Index data.
The Dow Jones Industrial Average (DJIA) shows a mild advance on Tuesday’s early trading. Wall Street has opened the session in green, with mega-cap growth stocks leading gains.
The index, however, remains far from the historic highs reached on Thursday. The dovishly-tilted monetary policy statement by the Federal Reserve boosted investors’ confidence that the Fed will start rolling back its restrictive policy in June, pushing global equity markets higher.
The US calendar is light this week, and investors are focusing on Friday’s US Personal Consumption Expenditures Prices Index data for further clues about the Fed’s monetary policy outlook.
Dow Jones news
The Dow Jones Industrial Average is 0.2% higher on Tuesday’s morning trading. Wall Street has opened the session with marginal gains, retracing Monday’s losses in an Easter-shortened week.
Down to sectors, Consumer Discretionary and Communication Services are leading gains, while Energy and Utilities are the worst performers.
United Health Group (UNH) is leading gains on Tuesday with a 1.3% advance, followed by Honeywell International (HON), up 1.1%, and Goldman Sachs (GS) with a 1.0% advance. On the downside, 3M (MMM) is the worst performer, losing 1.5%, followed by Boeing (BA), 1.2% down, on the back of news that CEO Jeremy Calhoun is leaving the company.
Dow Jones technical outlook
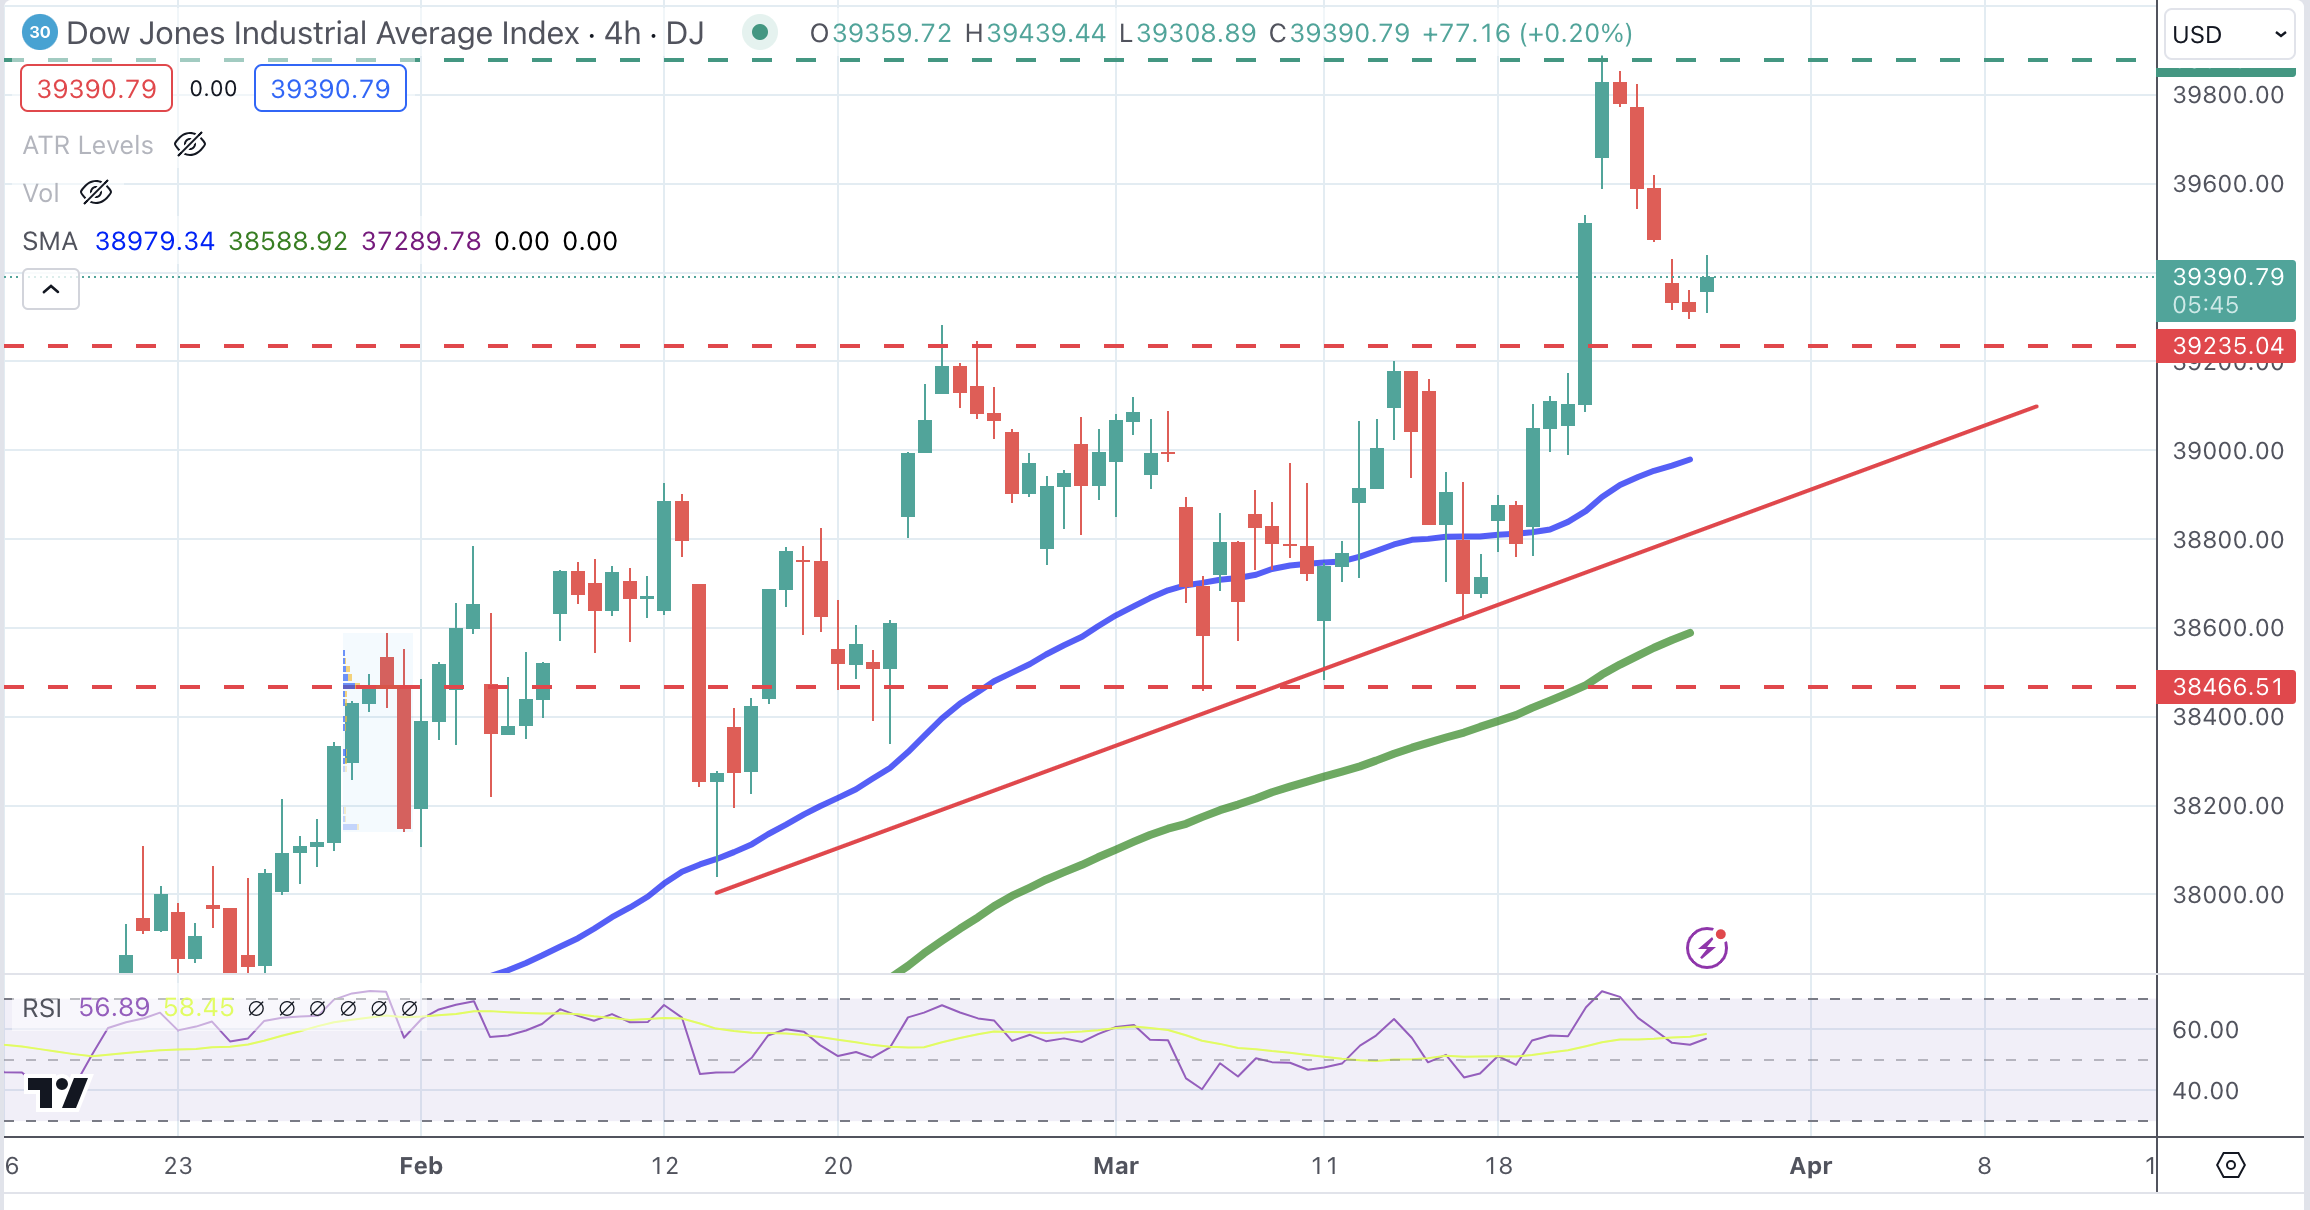
The broader bias for the Dow Jones Index remains bullish despite the recent reversal from all-time highs. Bears have been contained above previous highs, at the 39,260 area, which leaves the trend of higher highs and higher lows intact so far.
Sellers should breach that level to increase bearish momentum and open the path toward 39,000 and 38,650. On the upside, resistances are at the 39,900 previous high and the 40,000 psychological level.
Dow Jones Industrial Average 4-Hour Chart
Dow Jones FAQs
The Dow Jones Industrial Average, one of the oldest stock market indices in the world, is compiled of the 30 most traded stocks in the US. The index is price-weighted rather than weighted by capitalization. It is calculated by summing the prices of the constituent stocks and dividing them by a factor, currently 0.152. The index was founded by Charles Dow, who also founded the Wall Street Journal. In later years it has been criticized for not being broadly representative enough because it only tracks 30 conglomerates, unlike broader indices such as the S&P 500.
Many different factors drive the Dow Jones Industrial Average (DJIA). The aggregate performance of the component companies revealed in quarterly company earnings reports is the main one. US and global macroeconomic data also contributes as it impacts on investor sentiment. The level of interest rates, set by the Federal Reserve (Fed), also influences the DJIA as it affects the cost of credit, on which many corporations are heavily reliant. Therefore, inflation can be a major driver as well as other metrics which impact the Fed decisions.
Dow Theory is a method for identifying the primary trend of the stock market developed by Charles Dow. A key step is to compare the direction of the Dow Jones Industrial Average (DJIA) and the Dow Jones Transportation Average (DJTA) and only follow trends where both are moving in the same direction. Volume is a confirmatory criteria. The theory uses elements of peak and trough analysis. Dow’s theory posits three trend phases: accumulation, when smart money starts buying or selling; public participation, when the wider public joins in; and distribution, when the smart money exits.
There are a number of ways to trade the DJIA. One is to use ETFs which allow investors to trade the DJIA as a single security, rather than having to buy shares in all 30 constituent companies. A leading example is the SPDR Dow Jones Industrial Average ETF (DIA). DJIA futures contracts enable traders to speculate on the future value of the index and Options provide the right, but not the obligation, to buy or sell the index at a predetermined price in the future. Mutual funds enable investors to buy a share of a diversified portfolio of DJIA stocks thus providing exposure to the overall index.
Recommended Articles


