
Ethereum price set to close July in profit as BTCS ETH holdings hit $270 million
- Ethereum declines slightly from an intraday high of $3,941 amid overheated market conditions.
- BTCS increases ETH holdings to $270 million.
- Ethereum is up 53% in July, the second bullish month this year and paving the way for a potentially profitable third quarter.
Ethereum (ETH) price is marginally trimming gains, trading at $3,803 on Monday. The leading smart contract token by market capitalisation had extended the uptrend, reaching an intraday high of $3,941 before faltering to $3,773 (intraday low).
The demand for Ethereum as an alternative investment product for institutions stole the limelight last week, with capital inflows reaching $1.59 billion, according to a report from CoinShares. In contrast, Bitcoin (BTC) experienced minor outflows totaling $175 million.
If institutional and retail interest stabilizes over the coming days and weeks, Ethereum could maintain the uptrend, seeking to close the gap to its record high of $4,878. The derivatives market reflects this interest in the token, particularly with the futures Open Interest (OI) holding at peak levels of $58 billion.
BTCS boosts exposure with 14,240 ETH
BTCS Inc. (BTCS) announced on Monday the purchase of an additional 14,240 ETH at an average price of $3,850, bringing its total holdings to 70,028 ETH valued at around $270 million.
The blockchain technology-focused company, also referred to as Blockchain Technology Consensus Solutions, has closed its $10 million issuance of convertible notes, structured at a conversion price of approximately $13 per share.
BTCS CEO Charles Allen stated that the company’s Decentralized Finance (DeFi)/Traditional Finance (TradFi) Accretion Flywheel strategy has been bolstered and will continue to generate revenue and yield for shareholders, utilizing staking protocols such as NodeOps and Builder+.
“We are hitting our stride of actively deploying capital to not only expand our ETH treasury but also fuel our blockchain infrastructure operations and are proud to continue our trajectory as the most financially and operationally leveraged Ethereum play in public markets today,” Allen said in the press release.
BTCS has raised $207 million year-to-date, bolstering its strategic goal of growing Ethereum holdings and enhancing shareholder value.
Meanwhile, institutional and retail interest in ETH has seen the price rally 53% in July. If the uptrend steadies or the price stabilizes at elevated levels, Ethereum could close July in the green, marking the second profitable month of the year and a positive start to the third quarter.
According to CryptoQuant, ETH experienced a 41.1% surge in May, with the rest of the months averaging losses, as shown on the chart below.
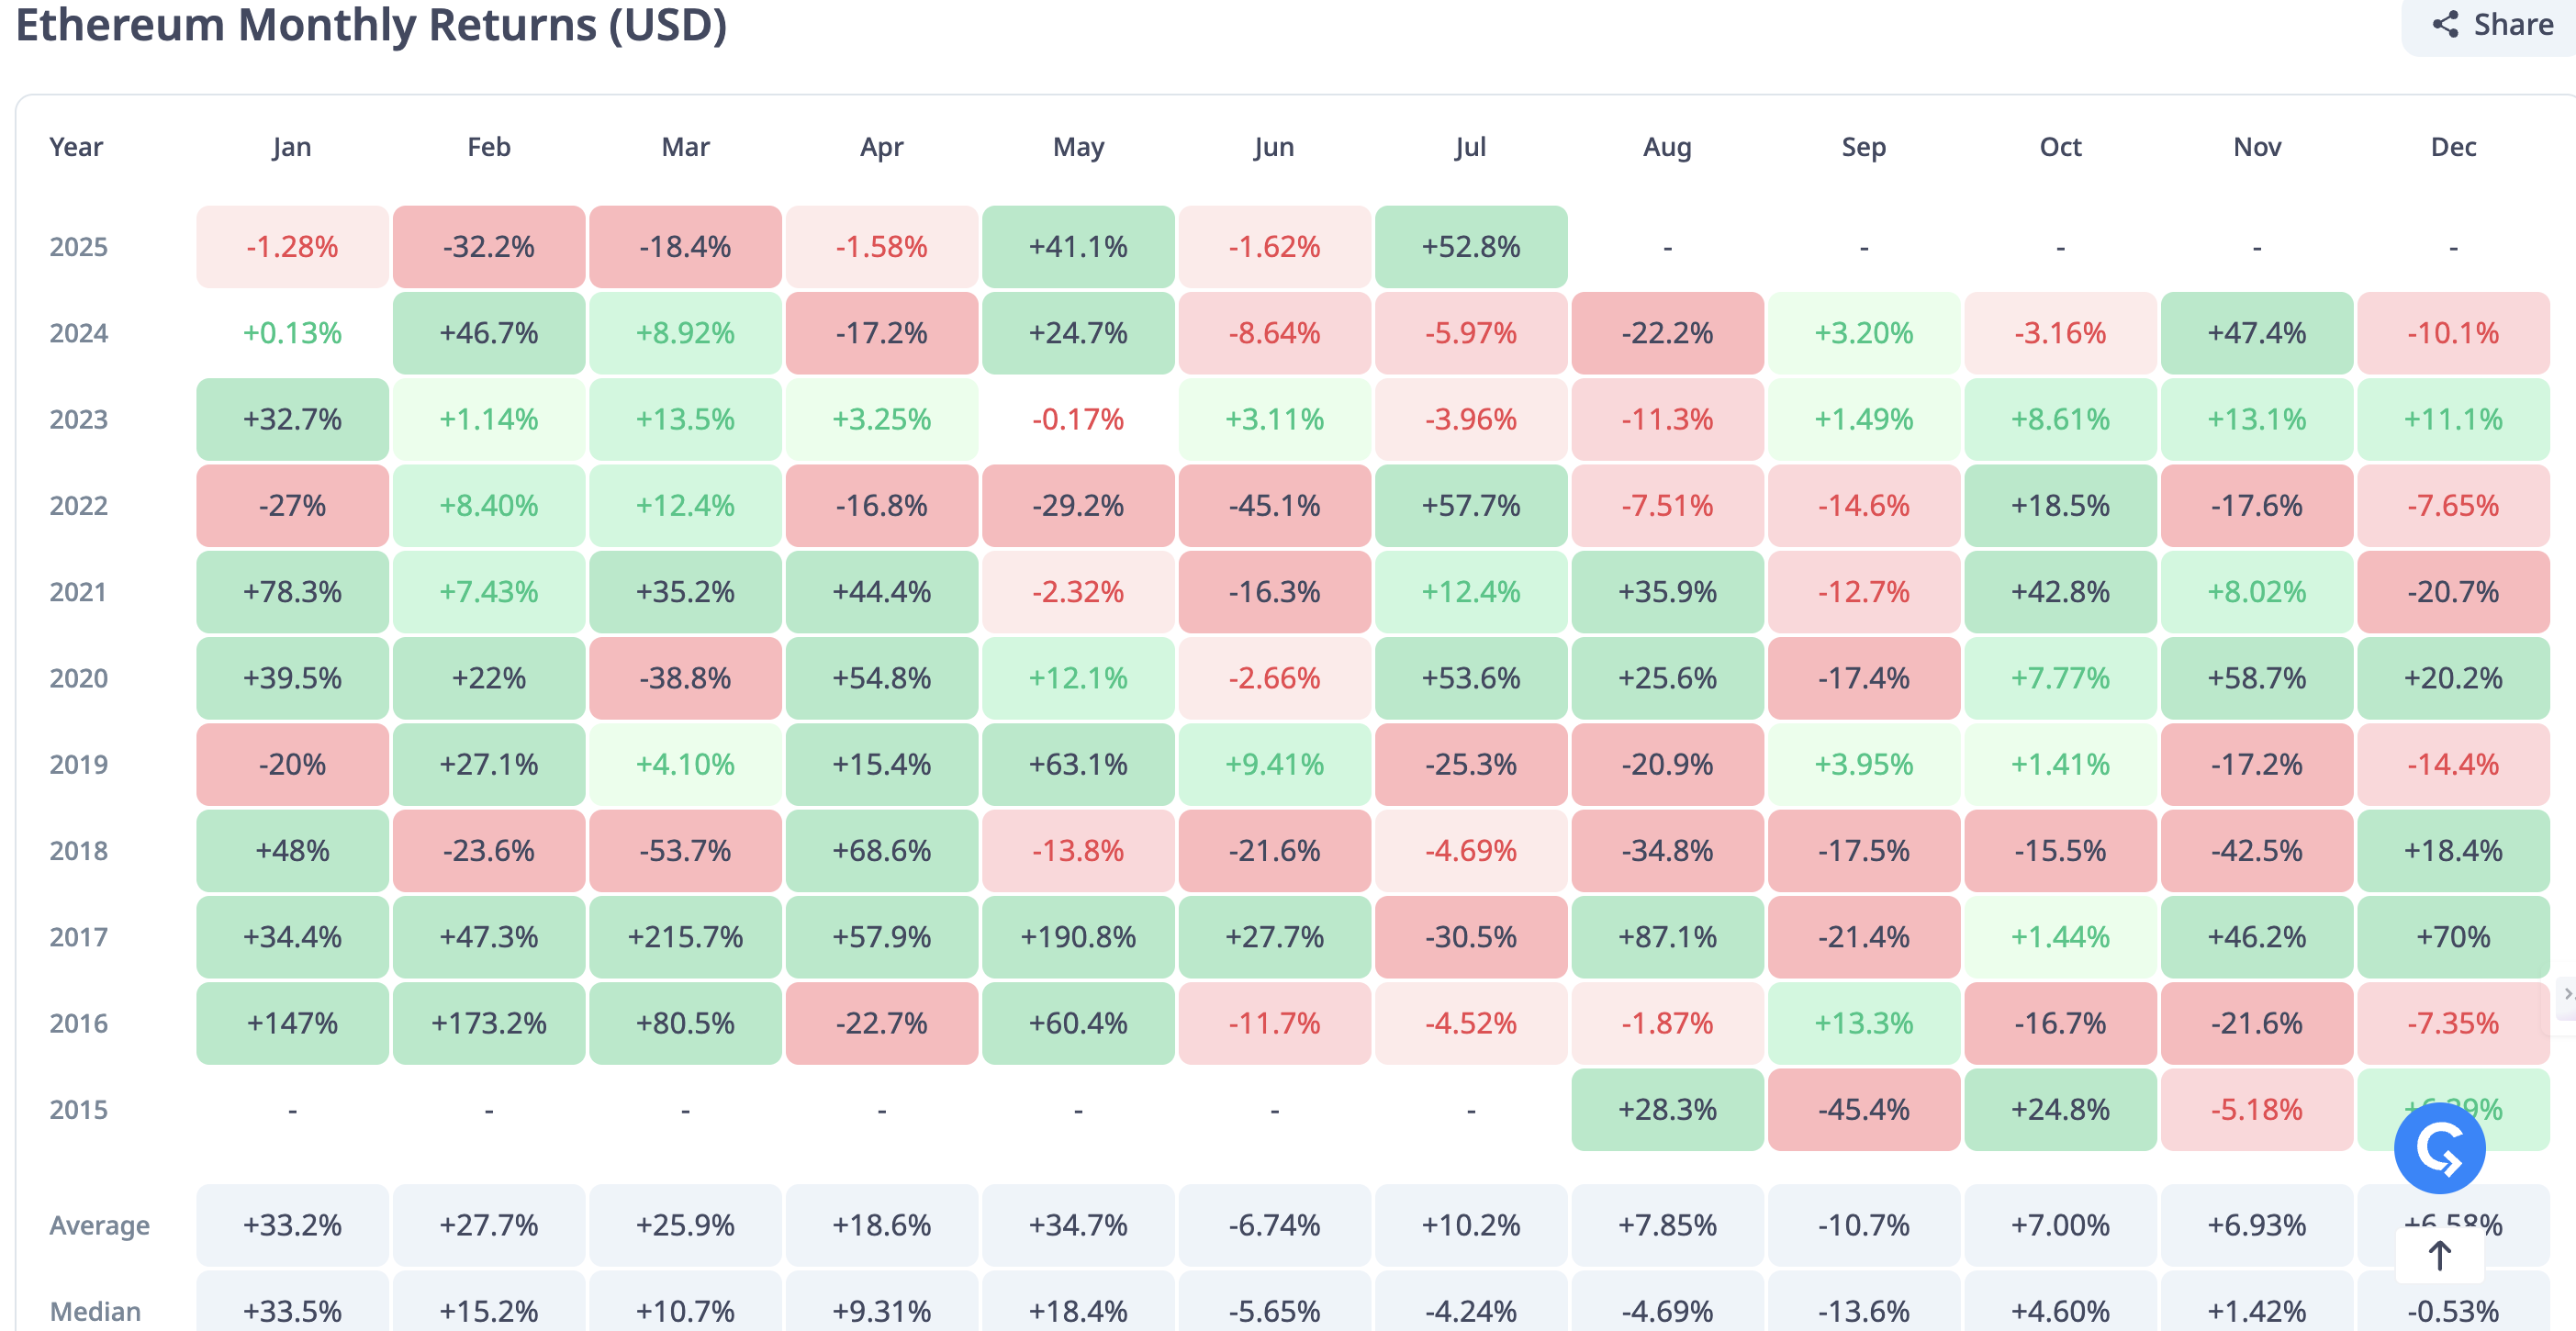
Ethereum Monthly Returns | Source: CryptoRank
Technical outlook: ETH bulls shrug off overheated market conditions
Ethereum price holds above its intraday low of $3,774 after taking a breather from its intraday high of $3,941. This minor correction reflects the sentiment in the broader cryptocurrency market, which has seen Bitcoin remain close to its support level at $118,000.
Key technical indicators shed light on the overheated market conditions, which could compel traders to tread cautiously in the coming sessions, citing a potential pullback. Although the Relative Strength Index (RSI) has declined to 76, it remains in overbought territory. If the decline continues, it would indicate a demand reduction and possibly lead to a price pullback.
Traders should also focus on the Moving Average Convergence Divergence (MACD) indicator, which could confirm a sell signal if downside risks persist. Such a signal, calling investors to consider reducing their exposure, would manifest when the blue MACD line crosses below the red signal line.
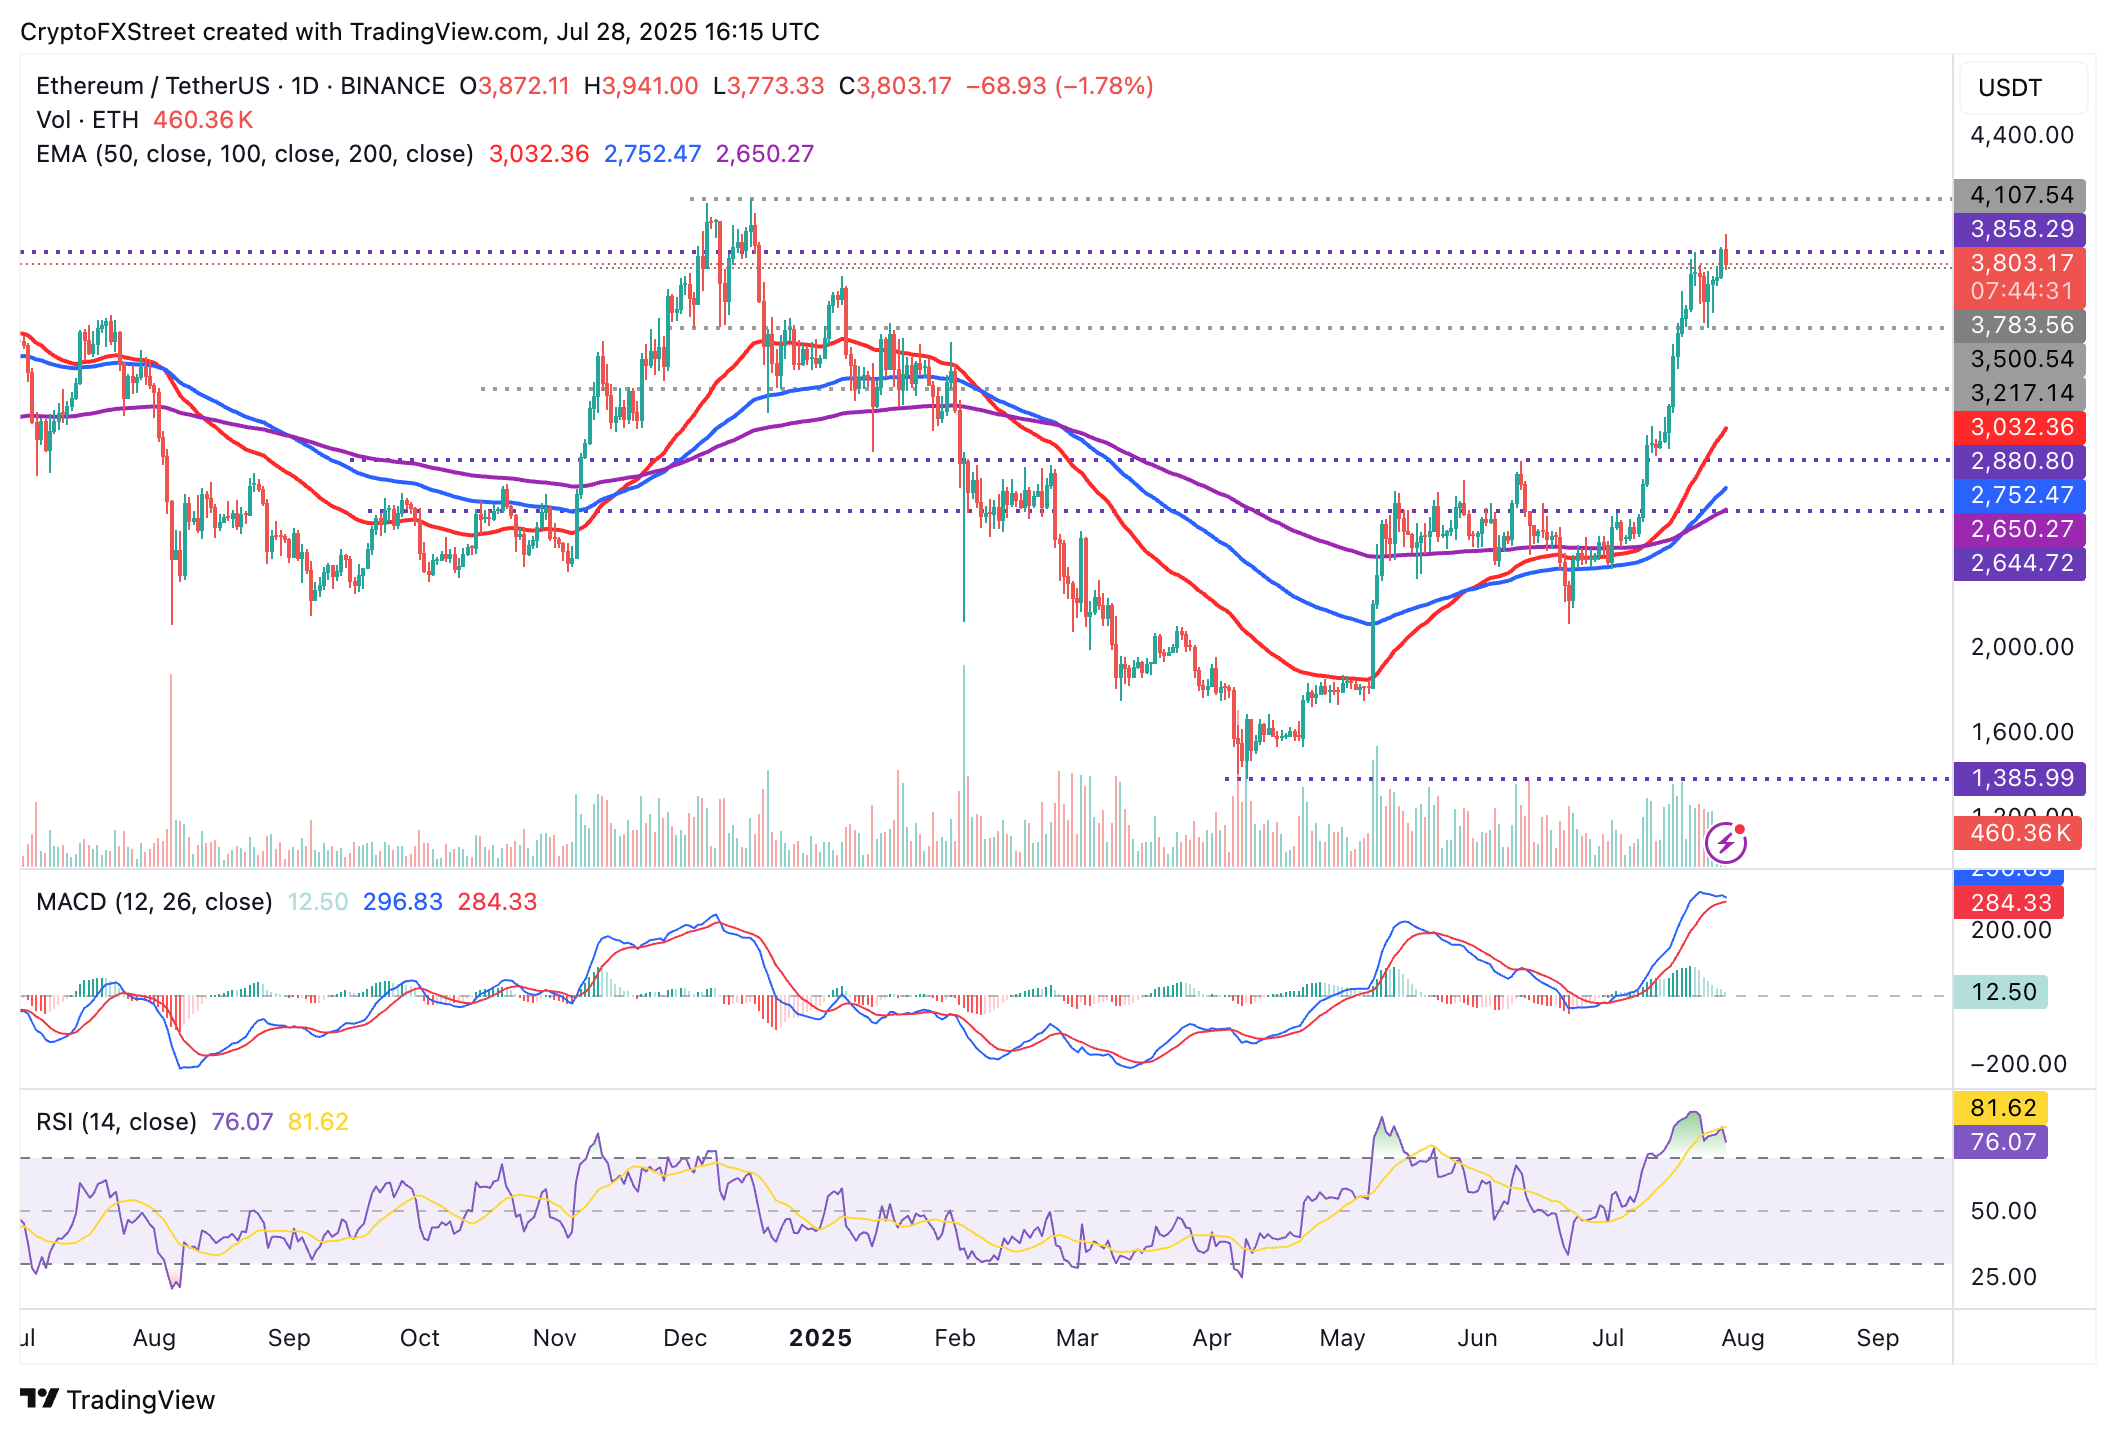
ETH/USDT daily chart
Still, Ethereum holds significantly above key moving averages, including the 50-day Exponential Moving Average (EMA) at $3,032, the 100-day EMA at $2,752 and the 200-day EMA at $2,650, all of which could serve as potential support levels if Ethereum aggressively trims the gains. All eyes would be directed to the $4,000 milestone, which if breached could encourage risk-on sentiment and boost ETH price toward its all-time high.
Cryptocurrency metrics FAQs
The developer or creator of each cryptocurrency decides on the total number of tokens that can be minted or issued. Only a certain number of these assets can be minted by mining, staking or other mechanisms. This is defined by the algorithm of the underlying blockchain technology. On the other hand, circulating supply can also be decreased via actions such as burning tokens, or mistakenly sending assets to addresses of other incompatible blockchains.
Market capitalization is the result of multiplying the circulating supply of a certain asset by the asset’s current market value.
Trading volume refers to the total number of tokens for a specific asset that has been transacted or exchanged between buyers and sellers within set trading hours, for example, 24 hours. It is used to gauge market sentiment, this metric combines all volumes on centralized exchanges and decentralized exchanges. Increasing trading volume often denotes the demand for a certain asset as more people are buying and selling the cryptocurrency.
Funding rates are a concept designed to encourage traders to take positions and ensure perpetual contract prices match spot markets. It defines a mechanism by exchanges to ensure that future prices and index prices periodic payments regularly converge. When the funding rate is positive, the price of the perpetual contract is higher than the mark price. This means traders who are bullish and have opened long positions pay traders who are in short positions. On the other hand, a negative funding rate means perpetual prices are below the mark price, and hence traders with short positions pay traders who have opened long positions.
Recommended Articles


